I. The site you're scrolling is the case study
Most people reading this got the link from me, mid-conversation, as an answer to some version of "okay, but can you actually build?" That's the job this site has. It doesn't run ads. It doesn't chase cold traffic. It sits here being the thing I'd otherwise have to describe, and when somebody wants to check whether the describing matches anything real, I send them a page.
So here's the page. This one is a build log. I've been min-maxxing the stack under this site, and somewhere in the middle of that work a conclusion fell out that I haven't seen written down anywhere: the tooling I spent years reaching for as a data engineer stopped earning its place, because three primitives in a workflow library now do the load-bearing part. This note is the long version of that claim, with the receipts inline.

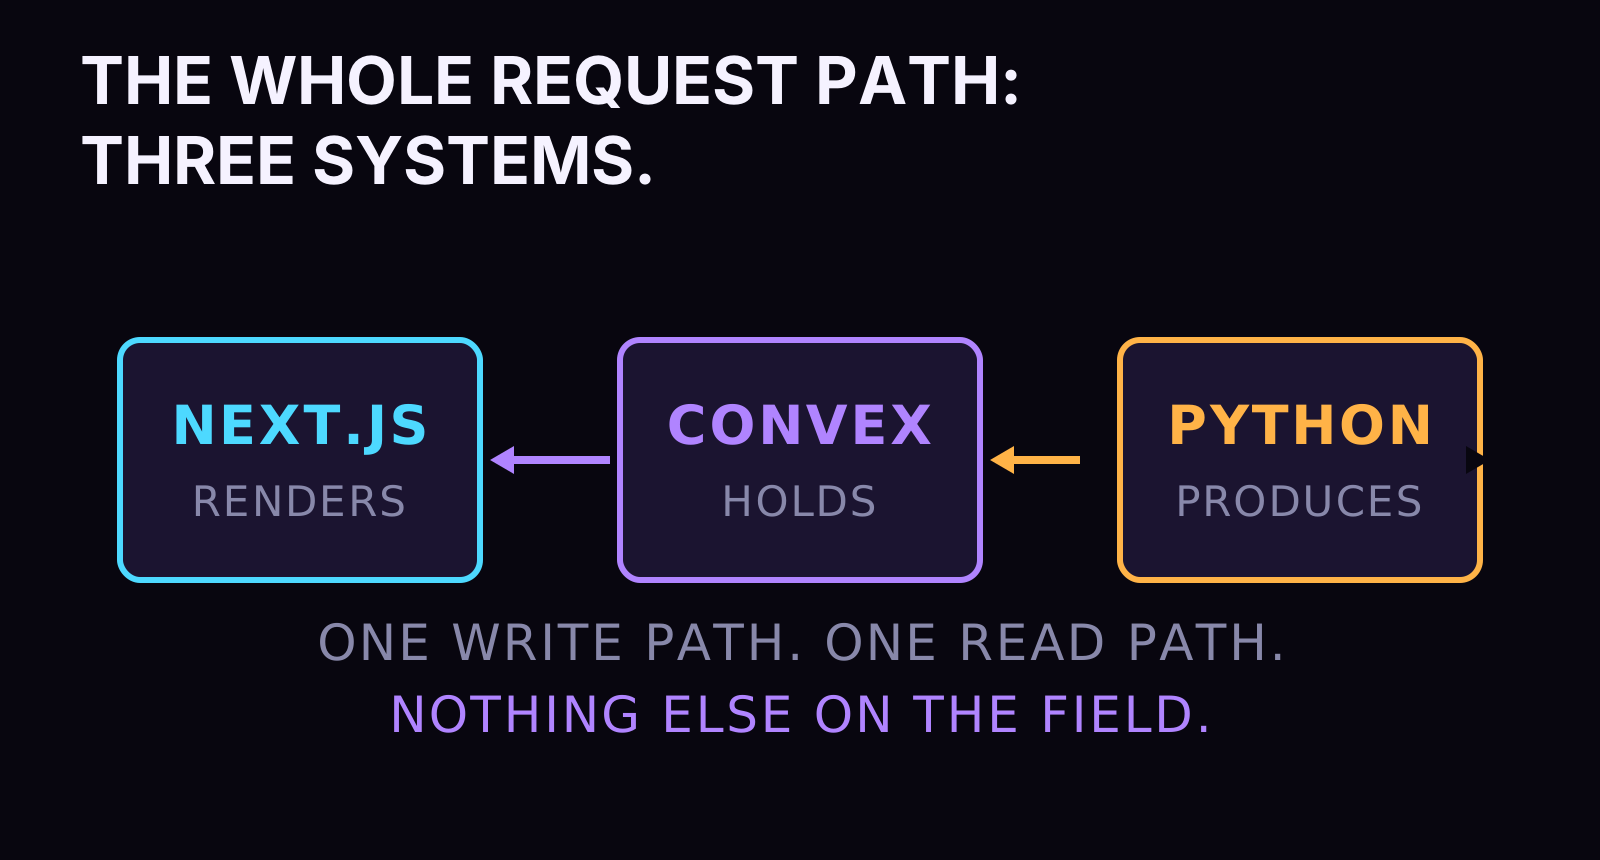
First, what's actually running when you scroll this page. Three systems. Next.js renders the site. Convex holds the data. Python runs the pipelines that produce what Convex holds. That's the whole diagram. There's no queue service in the corner, no separate search cluster, no cache layer with its own on-call rotation. When I say the site is a case study, this is the exhibit: a stack a single operator can hold in his head, doing work that usually gets a team and a vendor list.
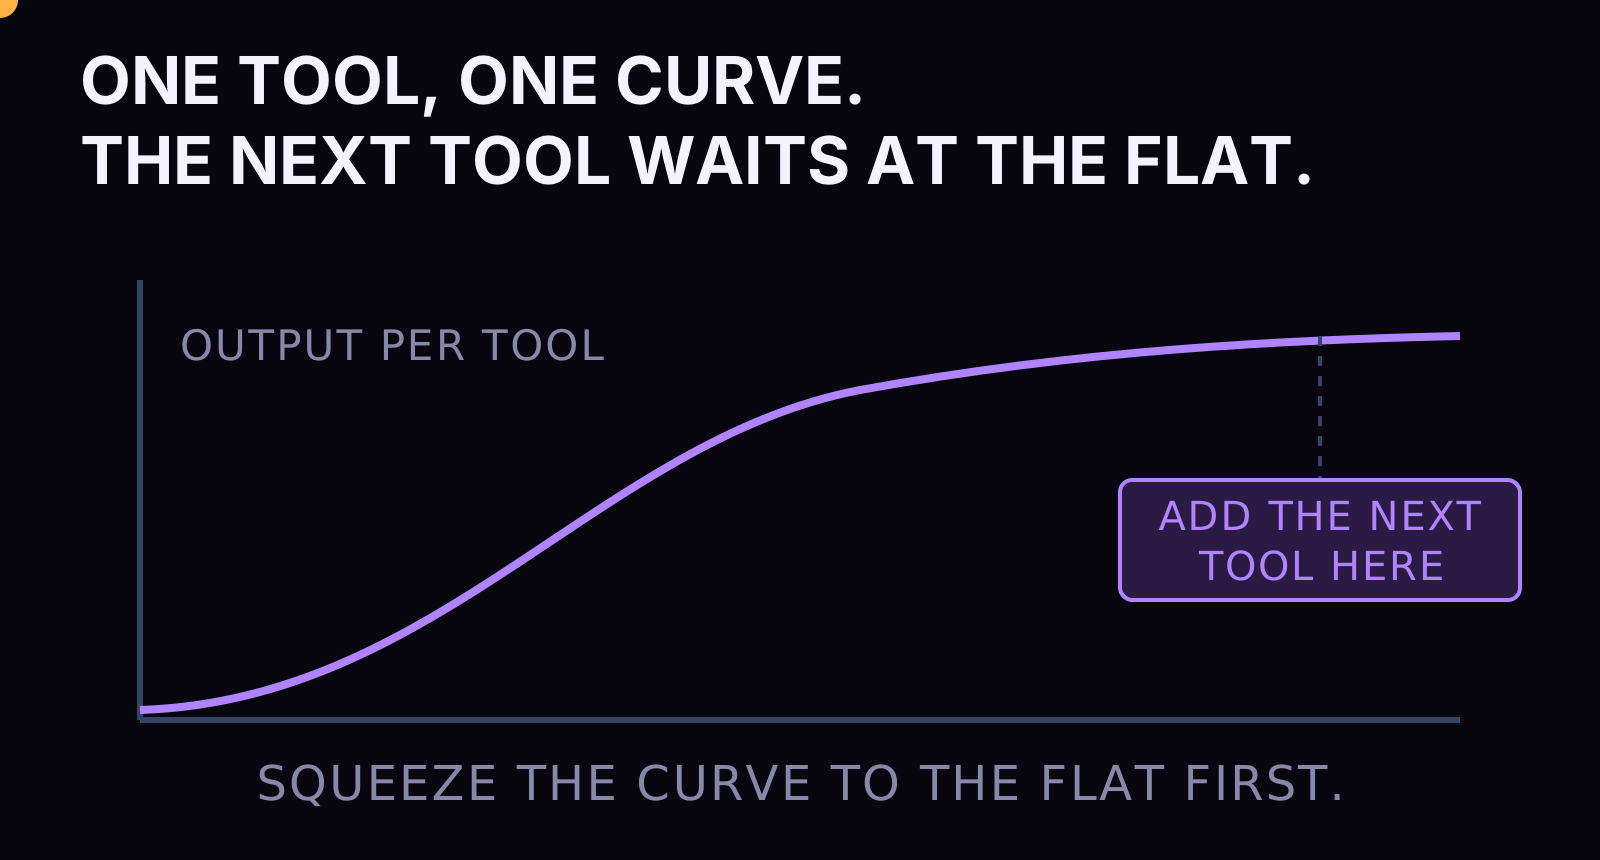
Min-maxxing is a gamer's word and I use it on purpose. In a character build you have finite points, and the build that wins puts them where the run actually spends its time, then strips everything that looked good on the character sheet and never fired in play. Applied to a stack it means one question, asked over and over: what can the parts I already have do, that I'm currently not asking them to do? You push each tool to the flat part of its curve before you're allowed to add another tool. Most teams do the opposite. A problem shows up, a product exists for the problem, the product gets added, and five years later the stack is a museum of decisions nobody re-audits.
The audits are boring, which is why they don't happen. Nobody gets a promotion for removing a service. The incentives all point toward addition: a new tool is a line on a resume, a migration is a project with your name on it, and the vendor's conference talk does the justifying for you. Removal has no conference. Removal just has a smaller bill, a shorter incident list, and a system one person can reason about at 2 a.m. Those are the exact things my clients are actually paying for, so removal is where I spend the points.

A word on the title on my business card, since "data engineer" now covers everything from spreadsheet cleanup to petabyte streaming. The work I mean: getting data from where it lands to where it earns, through pipelines that transform it, enrich it, embed it, score it, and put it somewhere a product can serve it. Ingestion, processing, storage, retrieval. The unglamorous middle of every system that people call "AI" from the outside. That middle has a famous tooling aisle, and this note is about why my cart came out of that aisle nearly empty.
Push each tool to the flat of its curve before you're allowed to add another tool.
Where the min-max habit comes from
The habit has two parents. The first is ad operations, where I managed roughly $50K a day in spend at peak, and where every wasted dollar is visible by lunch. Media buying at that intensity teaches you that budgets don't fail in one place; they leak through a hundred small allocations nobody rechecks, and the discipline that wins is the boring weekly audit that reallocates from the flat performers to the working ones. The second parent is a $60K algorithmic trading system I built, where the same lesson arrives with more violence: a strategy that was optimal under last quarter's conditions will quietly bleed under this quarter's, and the system that survives is the one that re-derives its allocations on schedule. Stacks are portfolios. Tools are positions. Most engineering organizations are running portfolios nobody has rebalanced since the money was allocated, and the drag compounds exactly the way unrebalanced portfolios always do.

What a tech buyer checks, and what this page is doing about it
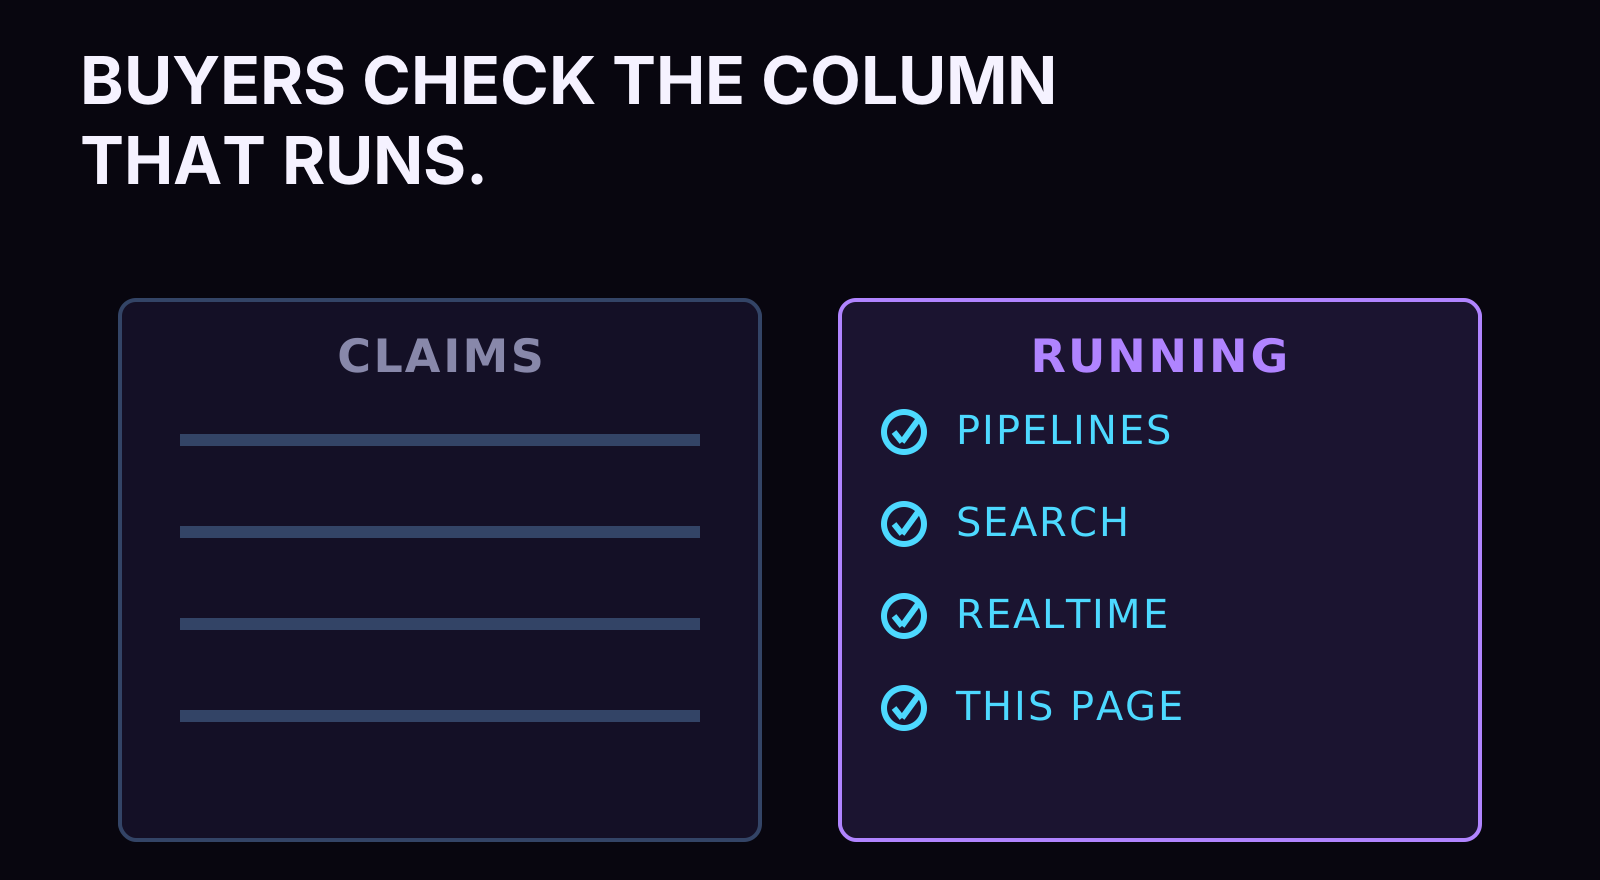
I've sat on both sides of the technical-evaluation table, and buyers with real money follow the same procedure whether they'd describe it this way or not. They ignore what you claim and probe what you run. A consultant whose own operation is a mess of duct tape is making a claim about how your project will go, louder than anything on his services page. So the stack behind this site is deliberately the same stack, the same disciplines, and the same cost rules I bring to client work. When I say every part earns its place, you're inside the evidence right now, and the rest of this note is me opening the panels so you can check the wiring.
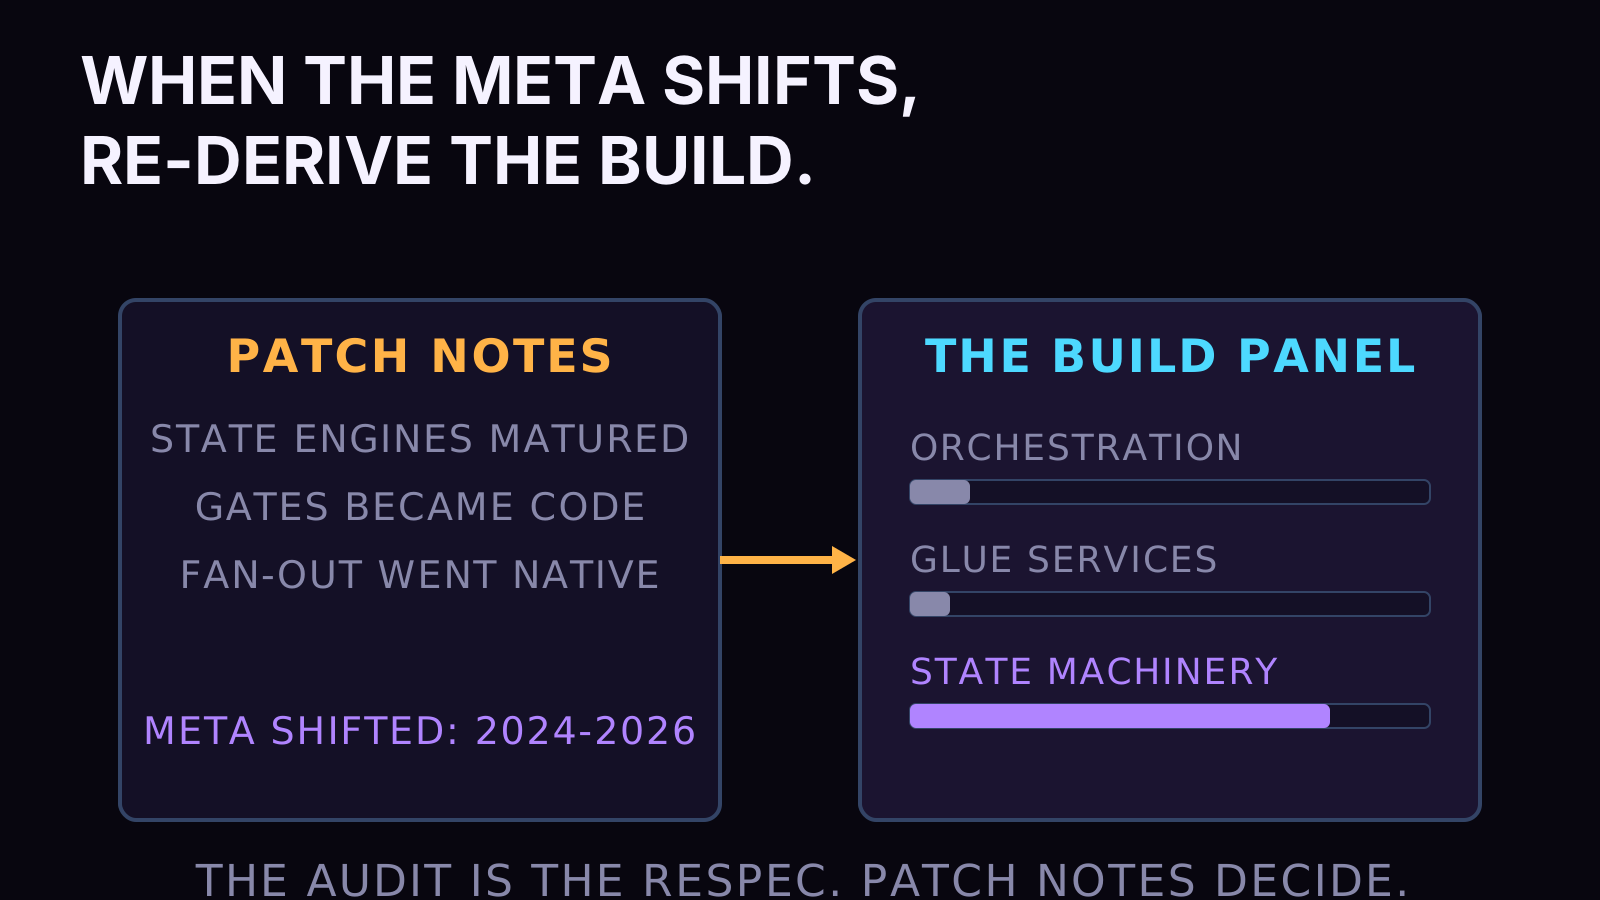
There's a second half to the gamer framing that matters more than the first. Min-maxxing includes the respec: when the meta shifts, a serious player re-derives the build from patch notes instead of loyalty. The data-engineering meta has shifted hard in the past two years, quietly, through libraries that got built for AI systems and turned out to carry general-purpose machinery. A build that was optimal in 2021 is a legacy build now, and the only way to notice is the audit nobody schedules. This note is one of my audits, published. The conclusion it reaches surprised me, and I've been doing this work for years across marketing data, trading systems, and content platforms.
One promise before we go: no vendor bashing and no benchmark theater. I'm not going to show you a chart where my stack is the tall green bar, because those charts are how the museum got built in the first place. The argument here is mechanical. I'll show you what the tooling class actually does when you decompose it, show you the three primitives that cover the load-bearing part, and let you check each mapping yourself. Where a boundary holds, I'll say so. There's a whole category of data work where the heavy tooling still wins, and pretending otherwise would make this note a pamphlet.
II. A tool earns five jobs before the next tool gets hired
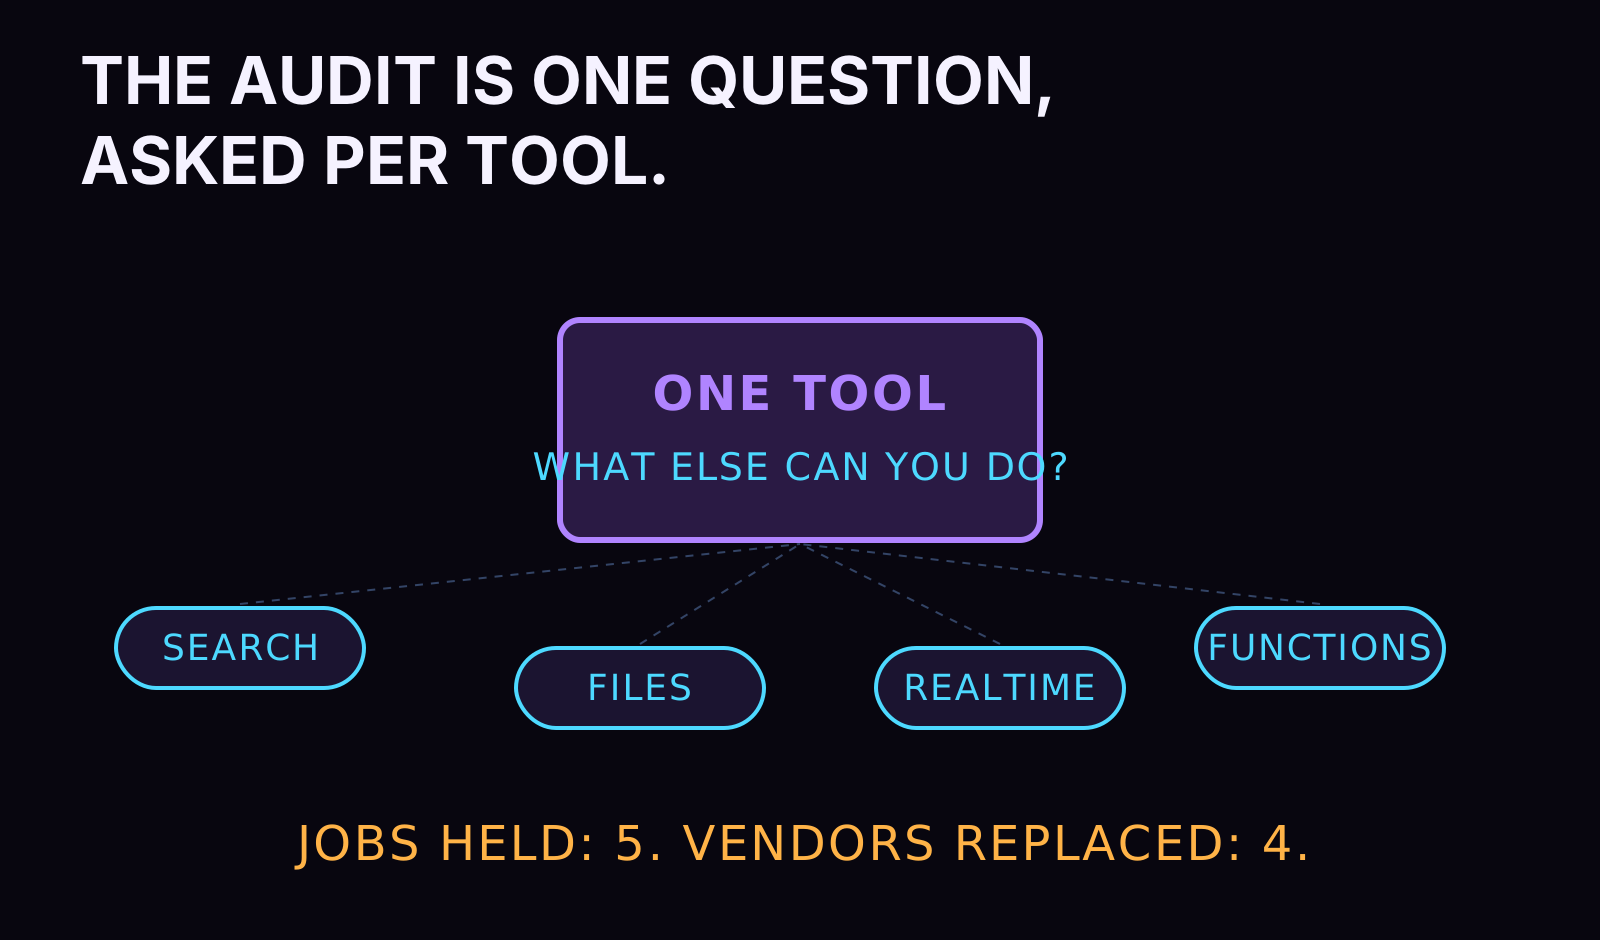
Start with the database, because that's where the min-max discipline pays first and pays biggest. Convex is the persistence layer here, and on a conventional architecture diagram it would occupy one box labeled "DB." On this site it occupies five. It's the database, the realtime layer, the full-text search engine, the file store, and the backend runtime, in one deployment with one config and one bill.
Walk the five. Database: documents with schema validation, indexes, and transactional mutations. Realtime: every query is a live subscription, which I'll come back to, because it quietly deletes an entire category of frontend plumbing. Search: full-text search indexes are declared on a table the same way ordinary indexes are, and queried from the same functions that do everything else. Files: uploads and serving, out of the same deployment. Functions: queries, mutations, actions, and cron schedules running server-side with no separate functions platform to babysit.
// Search is a declaration in the schema.
export default defineSchema({
  entries: defineTable({
    title: v.string(),
    body: v.string(),
    service: v.string(),
  }).searchIndex("search_body", {
    searchField: "body",
    filterFields: ["service"],
  }),
});
The search index up there is the reason this note exists now rather than next quarter. I'm building this site's search experience this week, and the entire infrastructure step of that project was those six lines. No search cluster, no sync pipeline keeping the cluster consistent with the database, no second query language, no second on-call surface. The sync pipeline is the part people underestimate: a separate search service costs you the component plus a permanent consistency job between it and your source of truth. Declaring the index inside the database deletes the consistency job, and the consistency job was always the expensive half.
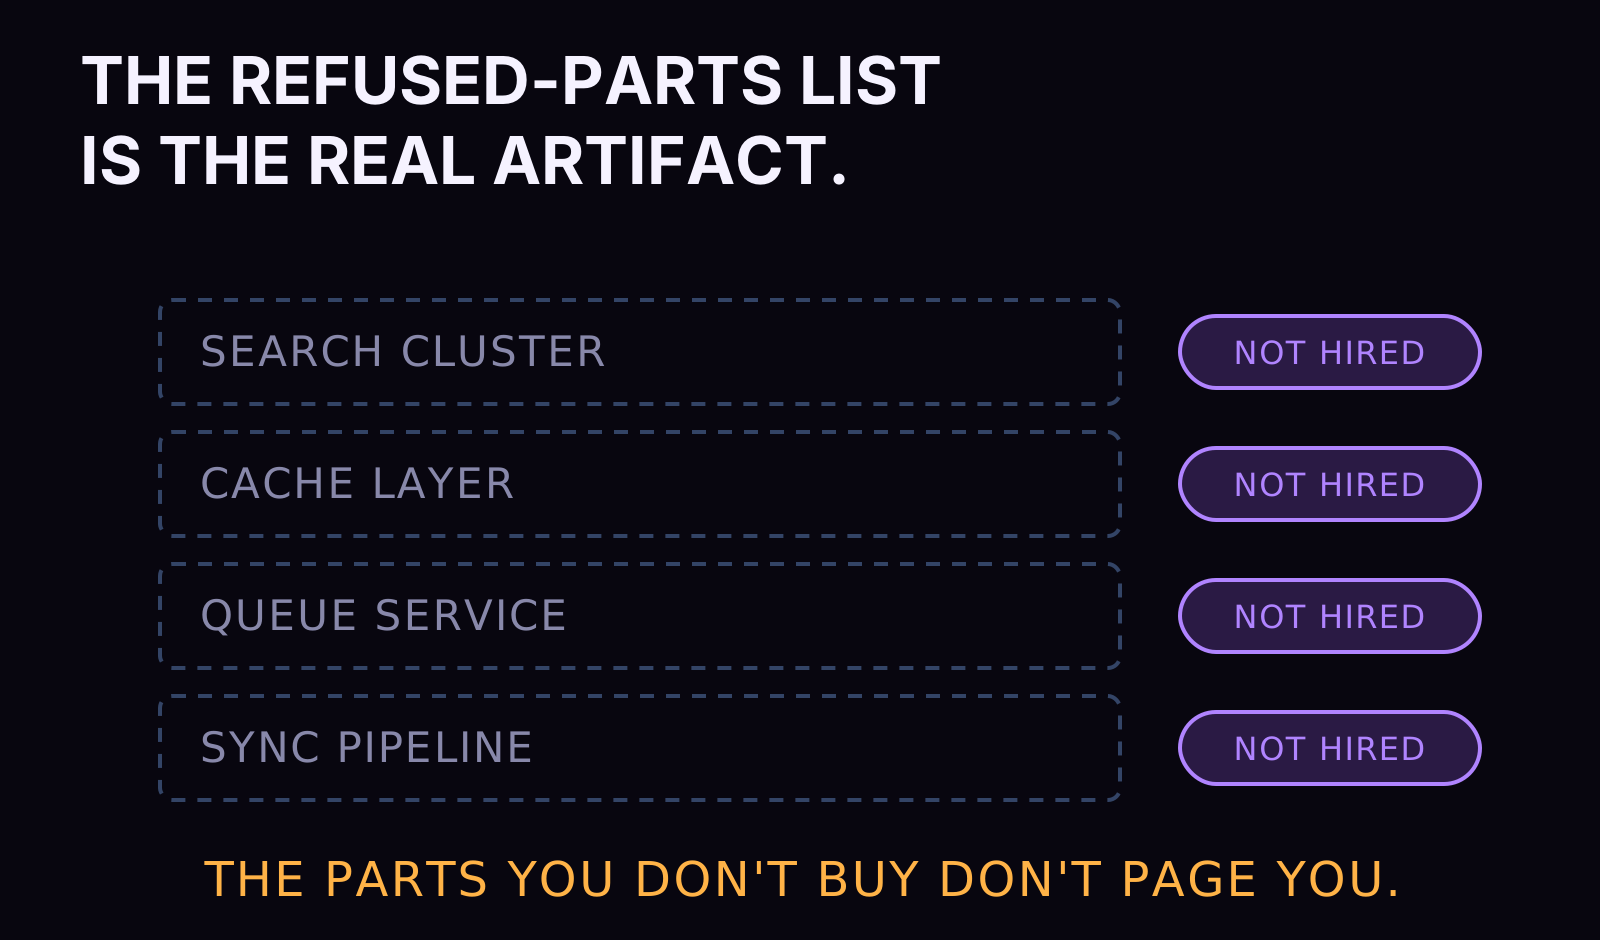
That's the pattern for the whole refused-parts list. A cache layer usually exists because queries are slow or expensive to re-run; Convex queries are reactive and cached by the platform, so the case for bolting a cache on the side never materialized. A queue service usually exists to get work off the request path; scheduled functions and actions cover that class here. Each refusal follows the same shape: the job still exists, and a part I already pay for absorbs it. The vendor didn't lose to a better vendor. The vendor lost to a line of config.
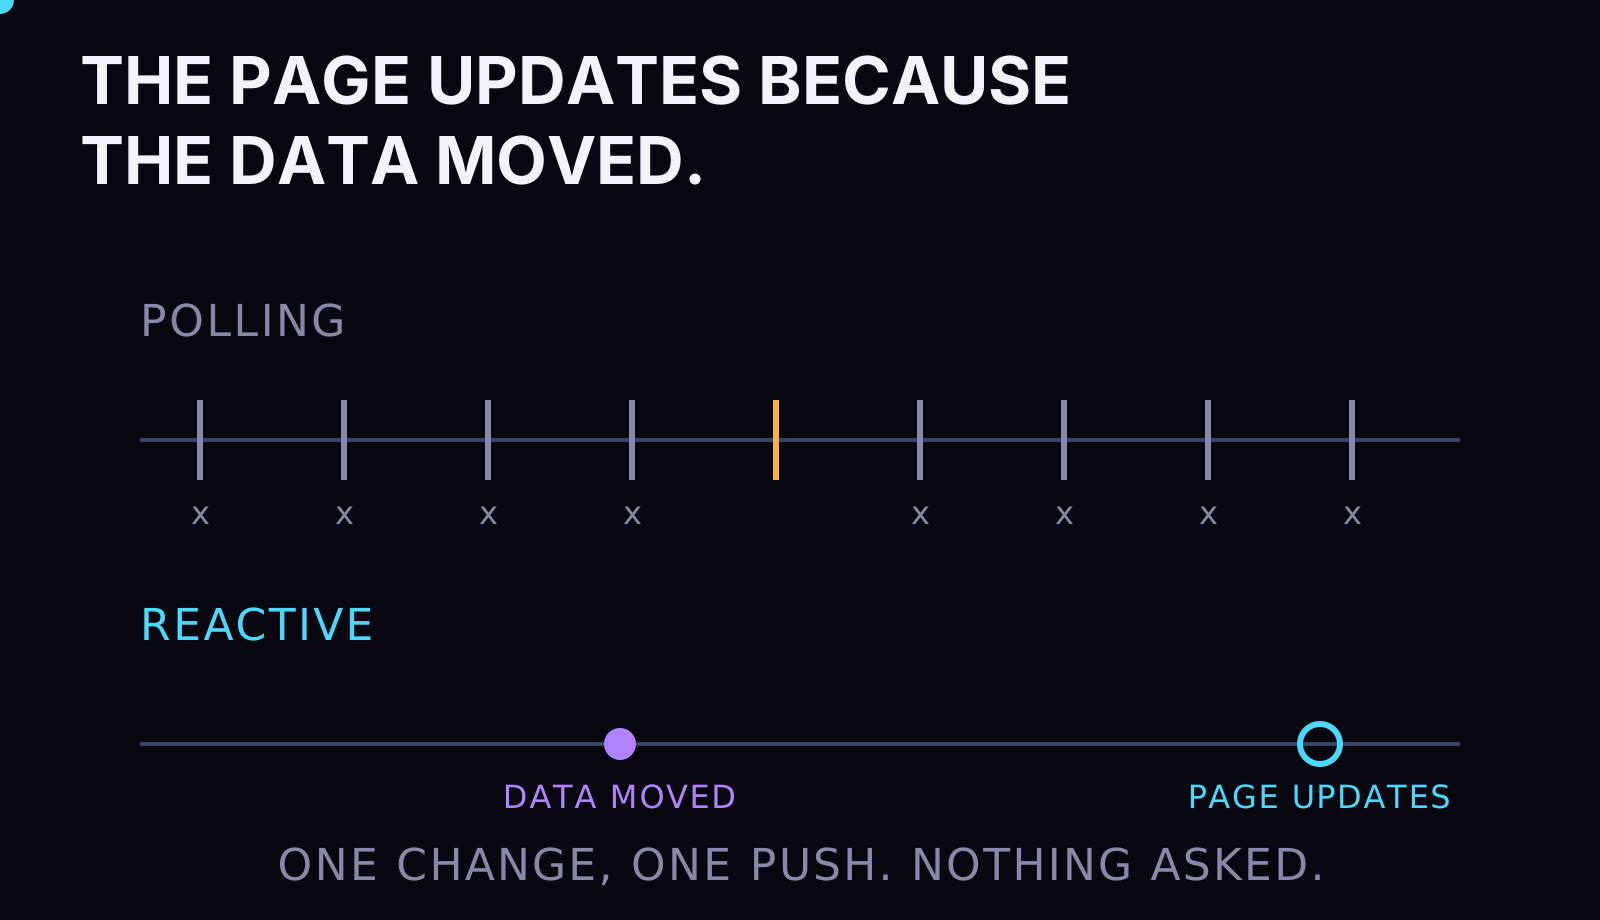
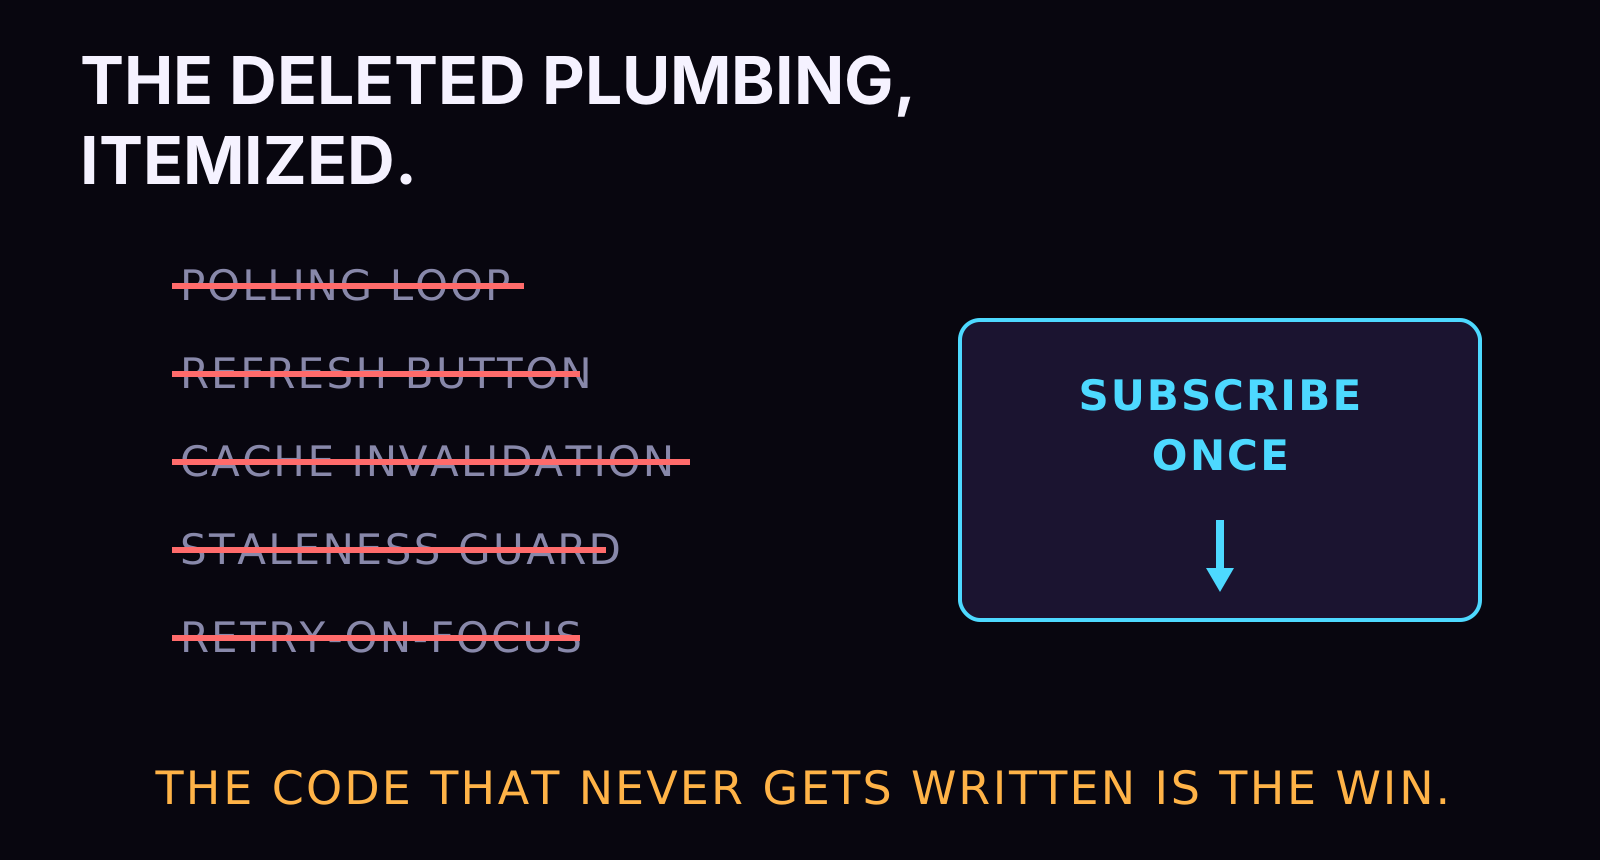
The realtime job deserves its own paragraph because it's the one that changes how the frontend gets written. A Convex query isn't a request, it's a subscription: the client holds it open, and when a mutation changes any data the query read, the new result gets pushed. All the polling loops, refresh buttons, cache-invalidation bugs, and "is this stale?" defensive code that fill a typical dashboard codebase just don't get written. When a pipeline finishes processing an article and writes the result, every open page showing that article updates itself. Nobody asked. That behavior comes free from where the data lives, which is exactly the kind of win min-maxxing hunts for: capability from position rather than effort.
The joints are where stacks die
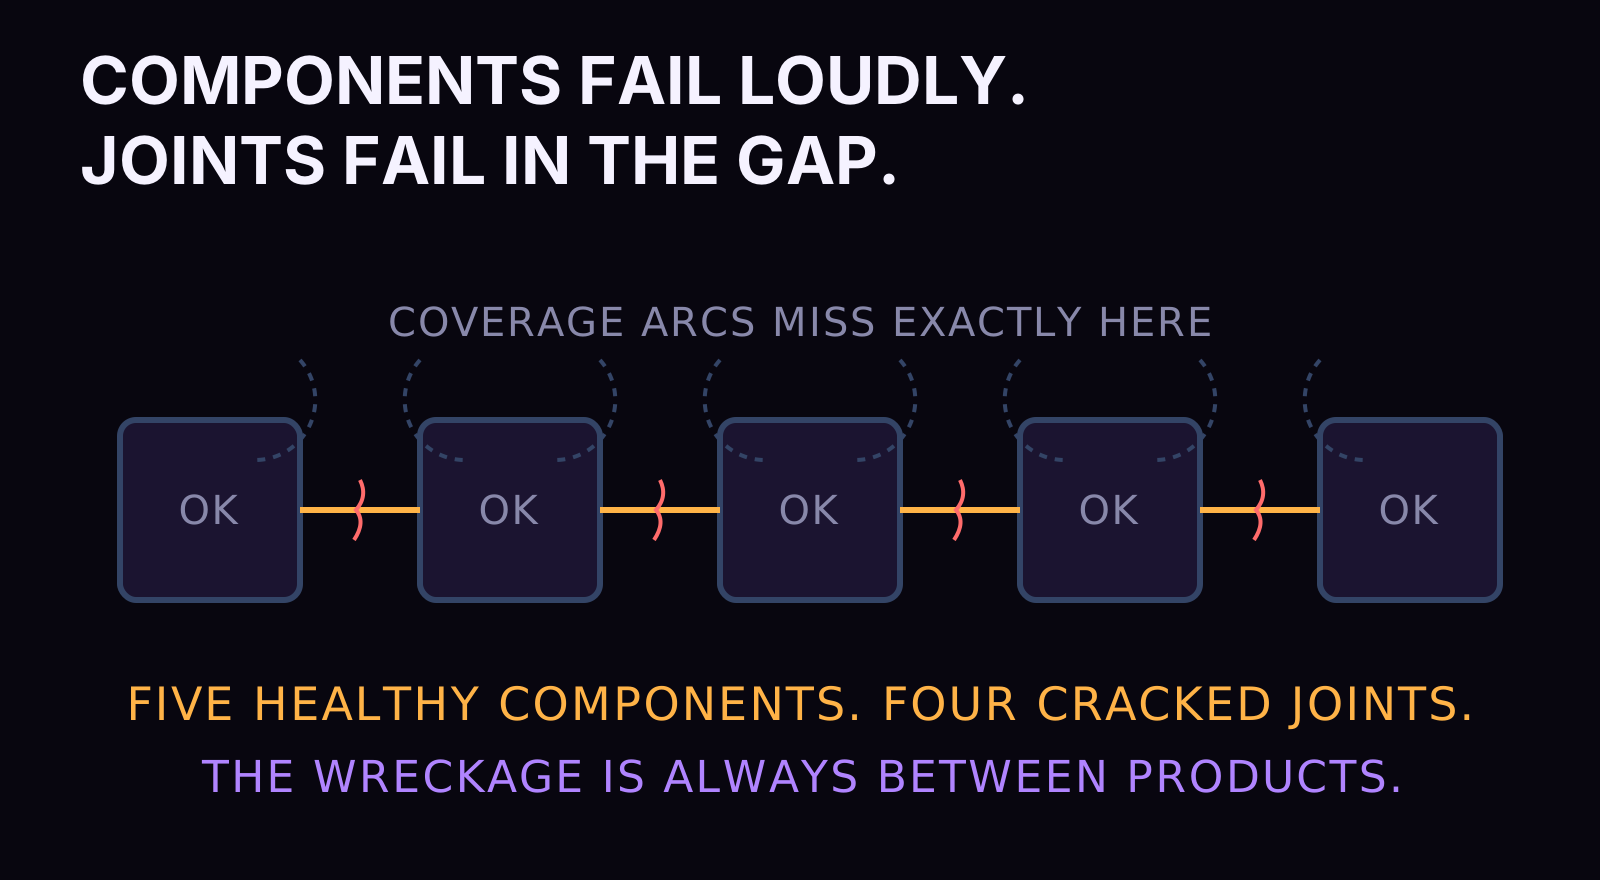
Here's the failure math that makes consolidation more than tidiness. A five-vendor stack has five components and, more expensively, the connections between them: the sync jobs, the auth handshakes, the version compatibilities, the retry semantics where system A's idea of "delivered" meets system B's idea of "received." Components fail loudly and get fixed. Joints fail quietly, in the gap where neither vendor's dashboard is watching, and every joint is a place where two teams' assumptions meet without a referee. When I audit a struggling data stack, the wreckage is almost never inside a product. It's between two products, in glue code some contractor wrote in 2023, unowned since.
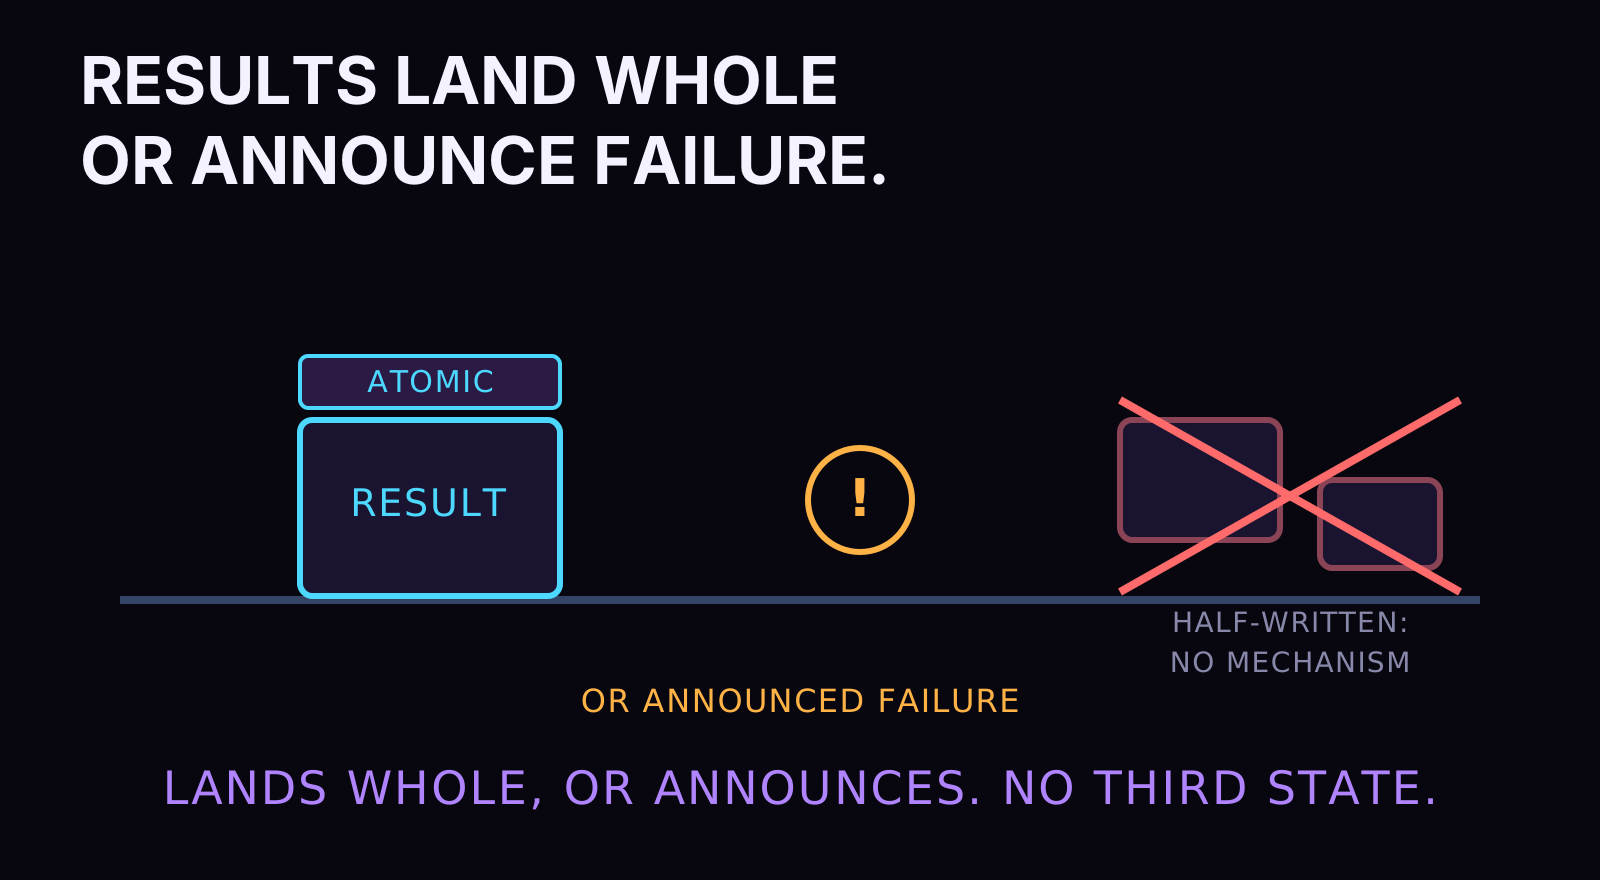
Consolidation attacks the joint count directly. Fold five jobs into one deployment and the four highest-risk seams stop existing; there's nothing to sync when the search index and the source of truth are the same system. That's also why the transactional story matters more than it sounds: Convex mutations are transactions, so a pipeline result lands atomically or lands as an announced failure. The half-written state that joint-failures manufacture, the row updated in one store and orphaned in the other, has no mechanism to occur. Deleting a failure mode beats monitoring it, every time it's available.
Config lives in the database, and the admin is a control panel
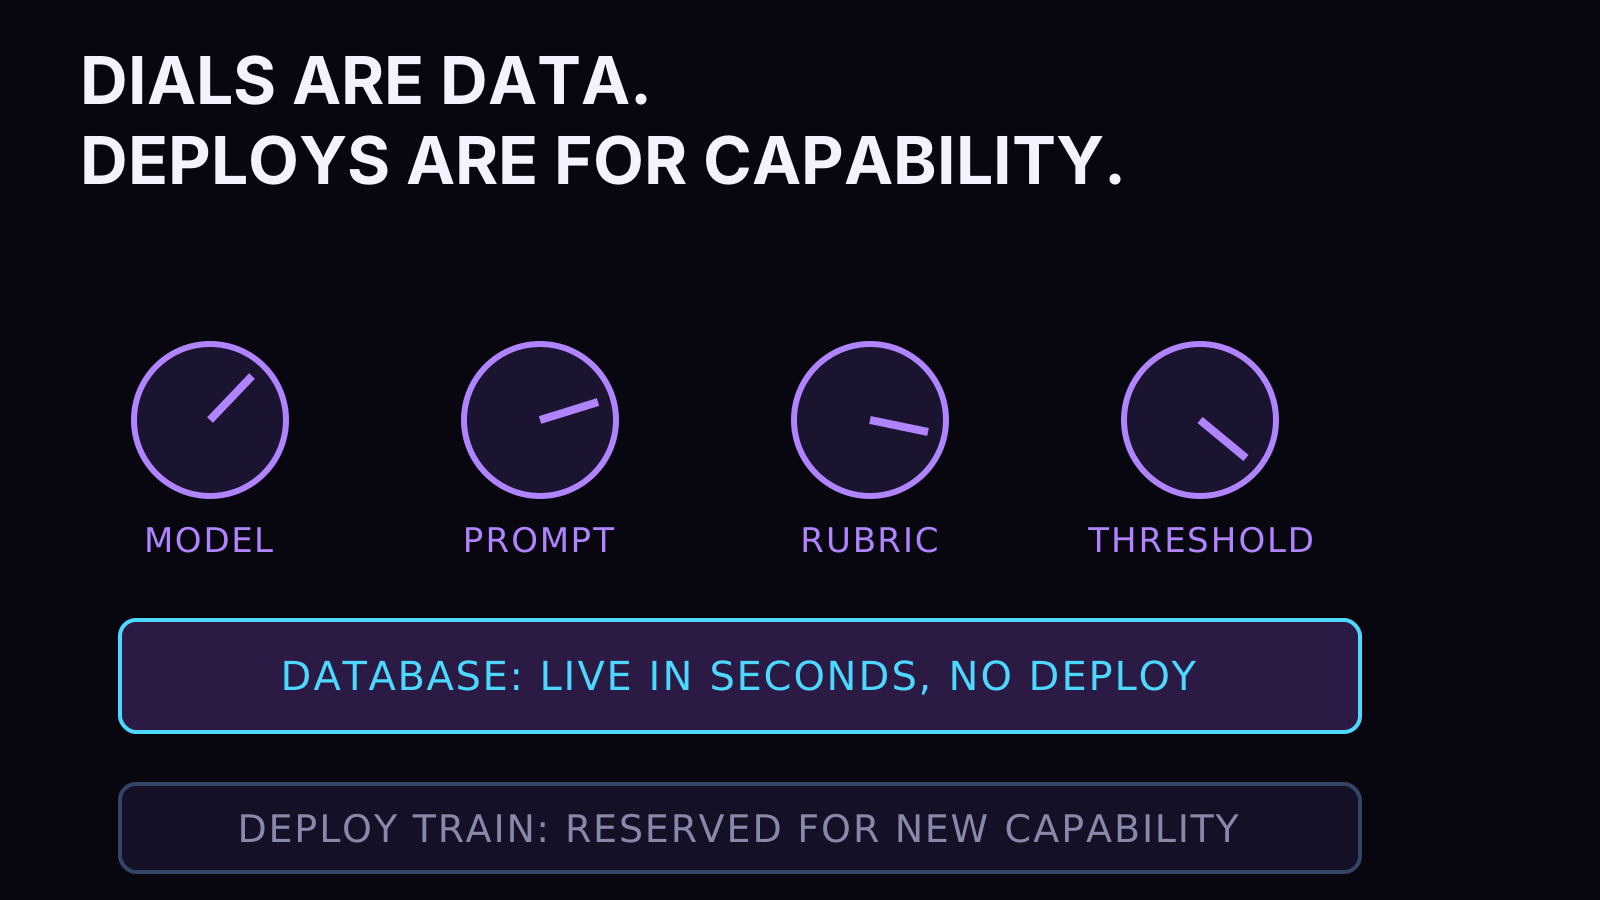
One more habit the consolidation enables, and it changes how the whole operation steers. Everything tunable about my pipelines, the model choices, the prompt templates, the rubric weights, the gate thresholds you'll meet in chapter five, lives in Convex as data rather than in Python as constants. The pipelines read their configuration at run start. Changing behavior is an edit in an admin surface, live in seconds, with the reactive layer pushing the change to every open screen. A deploy is for changing what the system can do; data is for changing what it does. Teams that hardcode their tuning end up shipping releases to turn a dial, and dial-turning by release train is how a two-minute fix becomes a two-day fix.

Underneath all of this sits a cost law I run everywhere, and it's blunt: if we're not getting value from it, we're not paying for it. Everything scales to zero. No instance floors, no always-on boxes waiting for traffic that arrives in bursts, no reserved capacity as a comfort blanket. That rule sounds like penny-pinching until you audit a real stack and find the meters running in empty rooms: the search cluster sized for a launch day two years gone, the queue nodes idling between nightly jobs, the warehouse compute that spins because someone left a dashboard on auto-refresh. Serverless-by-default is the billing form of the same min-max question: is this part earning, right now?
So where does Python fit, if Convex is doing five jobs? Python owns the pipelines. Everything that turns raw material into served data: parsing, chunking, enrichment, embedding, scoring, the workflow logic this whole note is about. The seam between the two worlds is deliberately one-directional. Pipelines write conclusions into Convex; surfaces read from Convex. The frontend never calls a pipeline, and a pipeline never renders anything. One source of truth in the middle, producers on one side, consumers on the other.
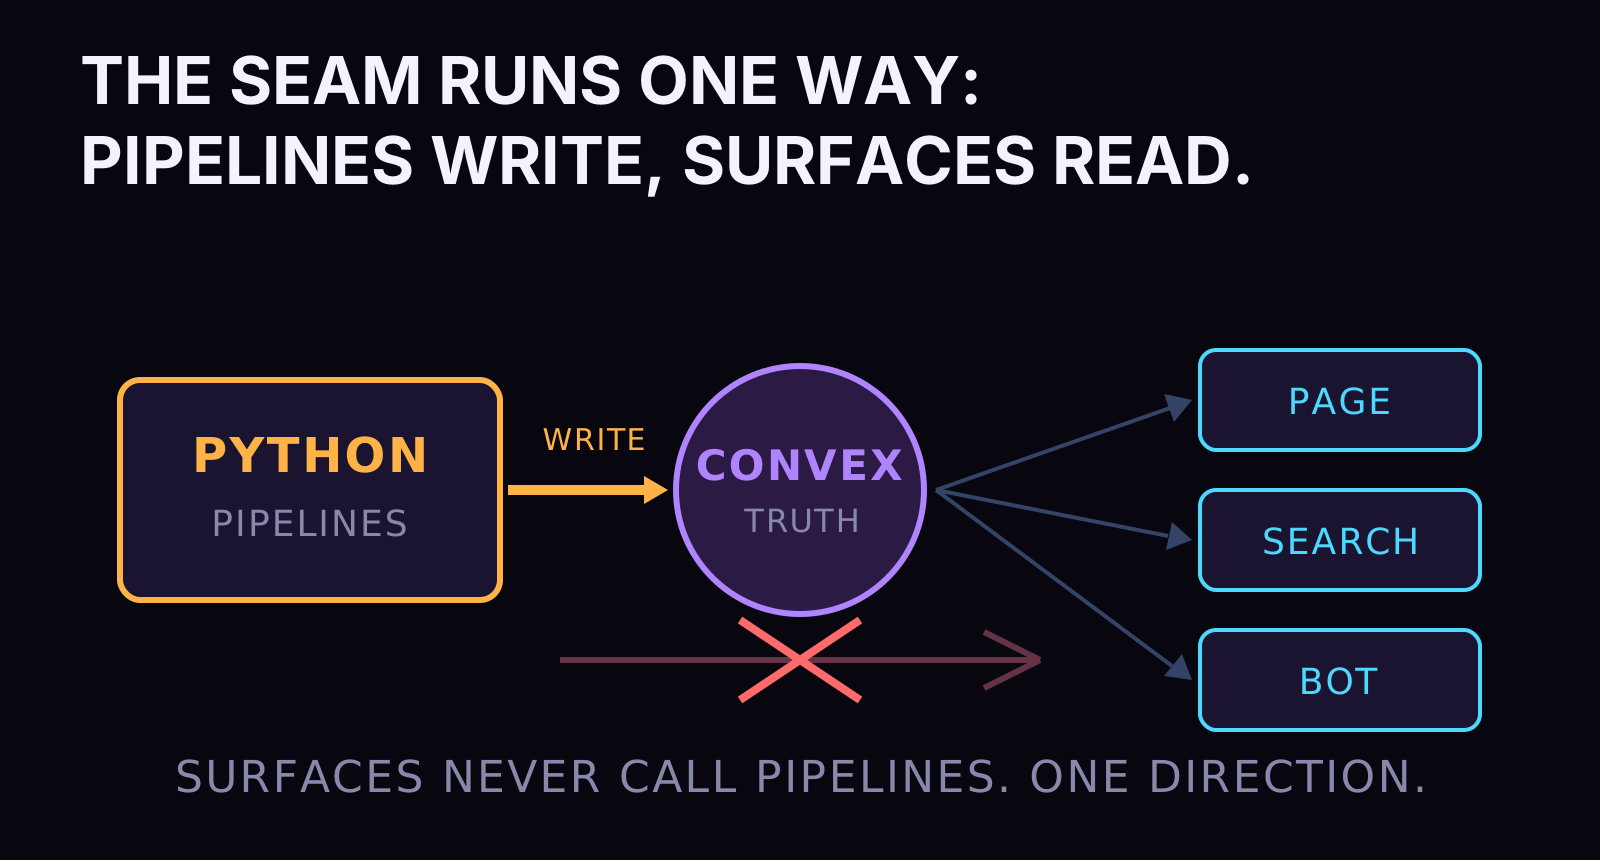
Why not one language for everything? Because min-maxxing is about where each tool's curve flattens, and the curves flatten in different places. TypeScript's curve is steepest at the surface: rendering, interaction, the reactive data layer. Python's is steepest in the pipeline: the typed-model ecosystem, the workflow library at the center of this note, and the mass of data tooling that speaks Python first. Forcing either language across the seam means operating on the flat of its curve, which is exactly the waste the discipline exists to catch.
That's the floor of the case study: three systems, five refused vendors, a bill that tracks value delivered, and a seam clean enough to explain in one sentence. None of it is exotic. Which sets up the question this note exists to answer, because the pipeline side of that seam is where the famous tooling aisle lives, and the aisle is where the min-max audit produced its strangest result. The next section decomposes what that aisle is actually selling.
III. A pipeline is a graph with state. Say it that way and the tool question changes
Every pipeline you've ever drawn on a whiteboard has the same three ingredients. Boxes that do work. Arrows that say what order the work happens in. And something, usually implicit, that carries results from box to box so a later step can use what an earlier step produced. Nodes, edges, and a thing that remembers. That's the entire species. Ingest, transform, enrich, load: whatever the labels say, the anatomy underneath doesn't change.
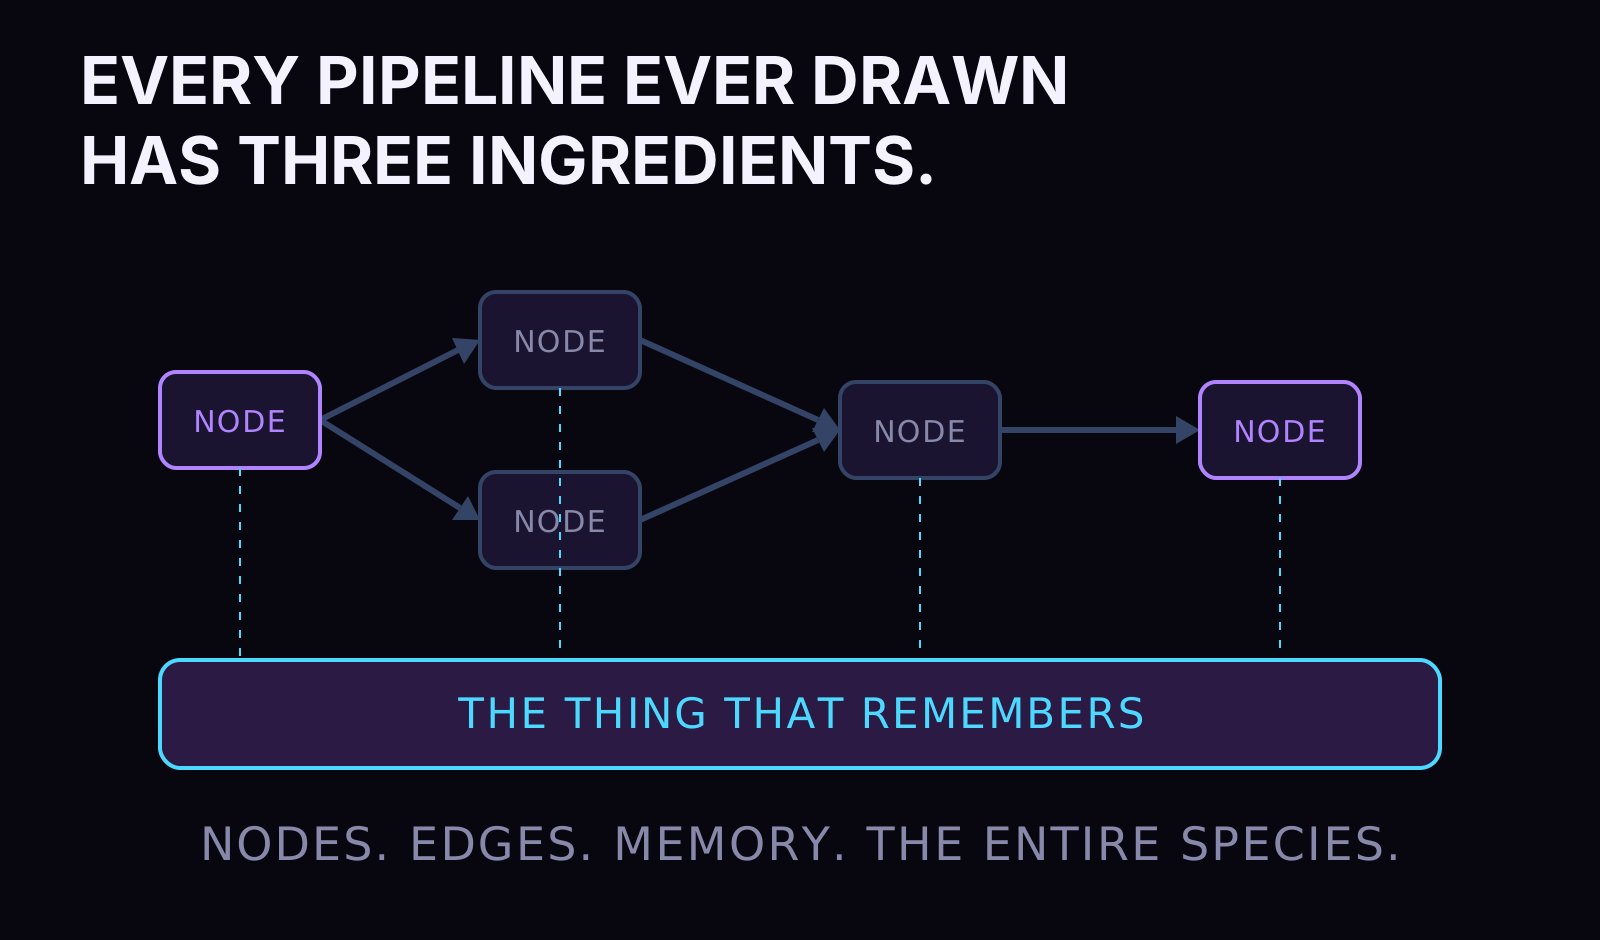
Now decompose what the pipeline-tooling aisle actually sells you. Strip the branding off any orchestrator, any workflow platform, any "data pipeline solution," and the feature list reduces to eight primitives. I'm listing them plainly because the whole argument of this note rests on this table being fair. Check it against whatever you run today.
| Primitive | What it means in practice |
|---|---|
| Dependency ordering | Step B runs after step A, because B needs what A made |
| Scheduling | The run starts at 2 a.m., or when a file lands |
| Retries | A flaky step gets another attempt before the run fails |
| State passing | Step B can read what step A produced without a side channel |
| Branching | The run takes a different path when a condition holds |
| Fan-out | One step becomes N parallel copies, one per work item |
| Observability | You can see what ran, what failed, and why |
| Recovery | A failed run resumes from where it died instead of starting over |
Eight primitives. Here's the observation that started my audit: not one of them requires a platform. Each one is a property a program can have, and the aisle exists because for about a decade the easiest way to give your pipelines those properties was to buy them as a bundle and accept the platform that came attached. The platform then brought its own gravity: its own server to run, its own DSL or decorator dialect to write, its own UI to check, its own deployment story, its own failure modes layered on top of yours.

How did eight primitives become a product category in the first place? Compressed history: the bundle made sense when it formed. In the cluster era, coordinating work across a fleet of machines was genuinely beyond a single program, so coordination moved into platforms, and a generation of engineers, me included, learned pipelines as something you configure at a platform rather than something you write in a language. The platforms then rode two waves of inertia: cloud vendors packaged them as managed services, which made installing one the path of least resistance, and hiring pipelines taught the tools as the job itself. None of that was a scam. It was the right trade under old constraints, and constraints moved while the defaults stood still. Libraries got process-level durability, languages got mature async, and the coordination that once required a fleet came home to the program. The aisle survives on the memory of the old constraint, and memory is a powerful vendor.
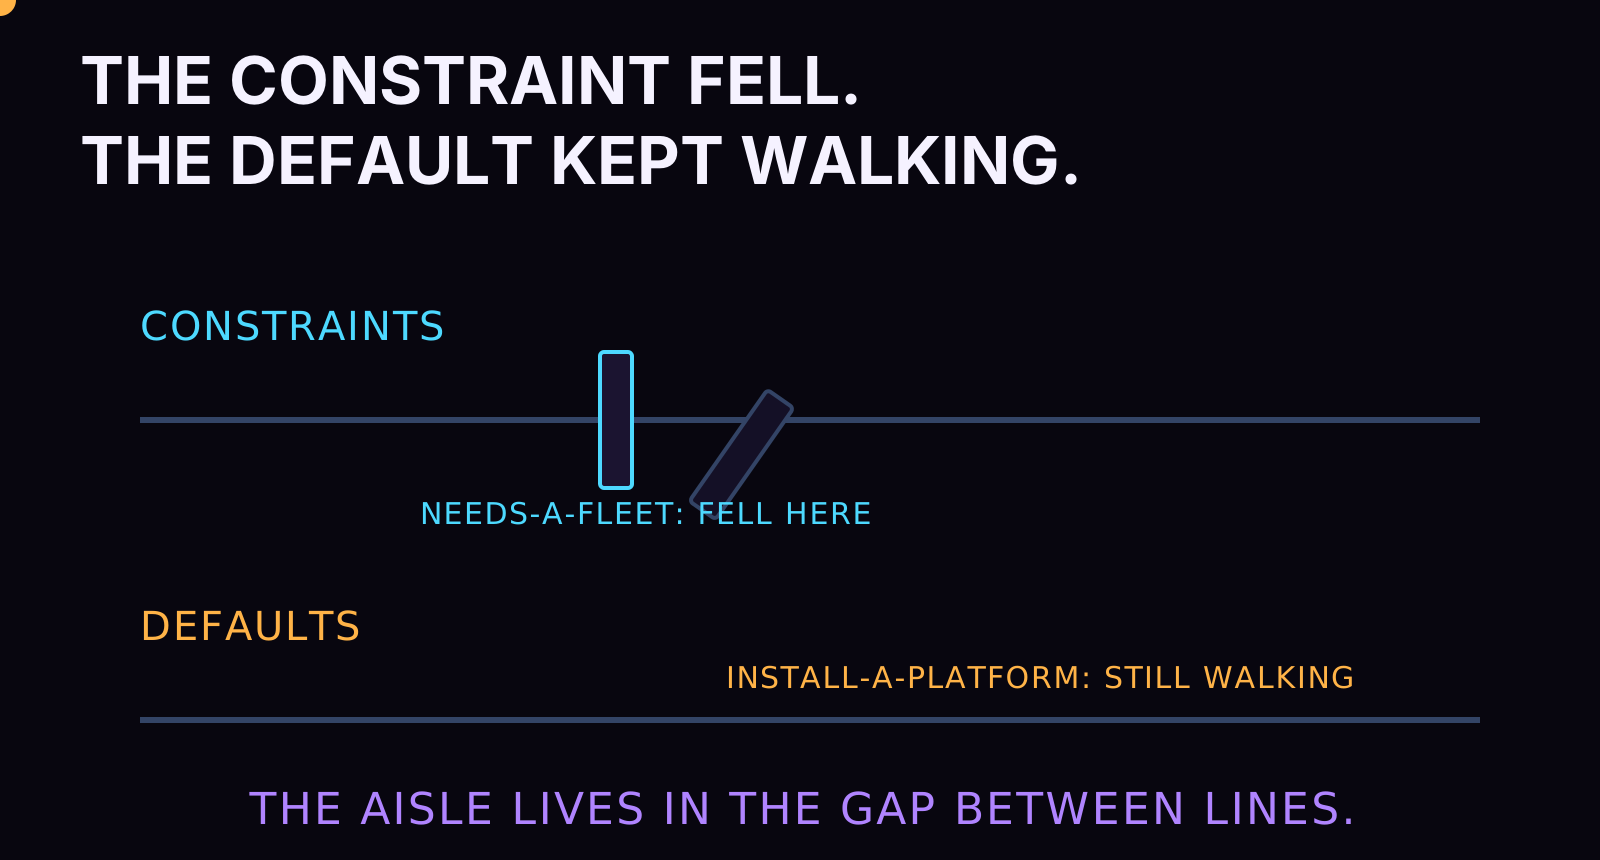
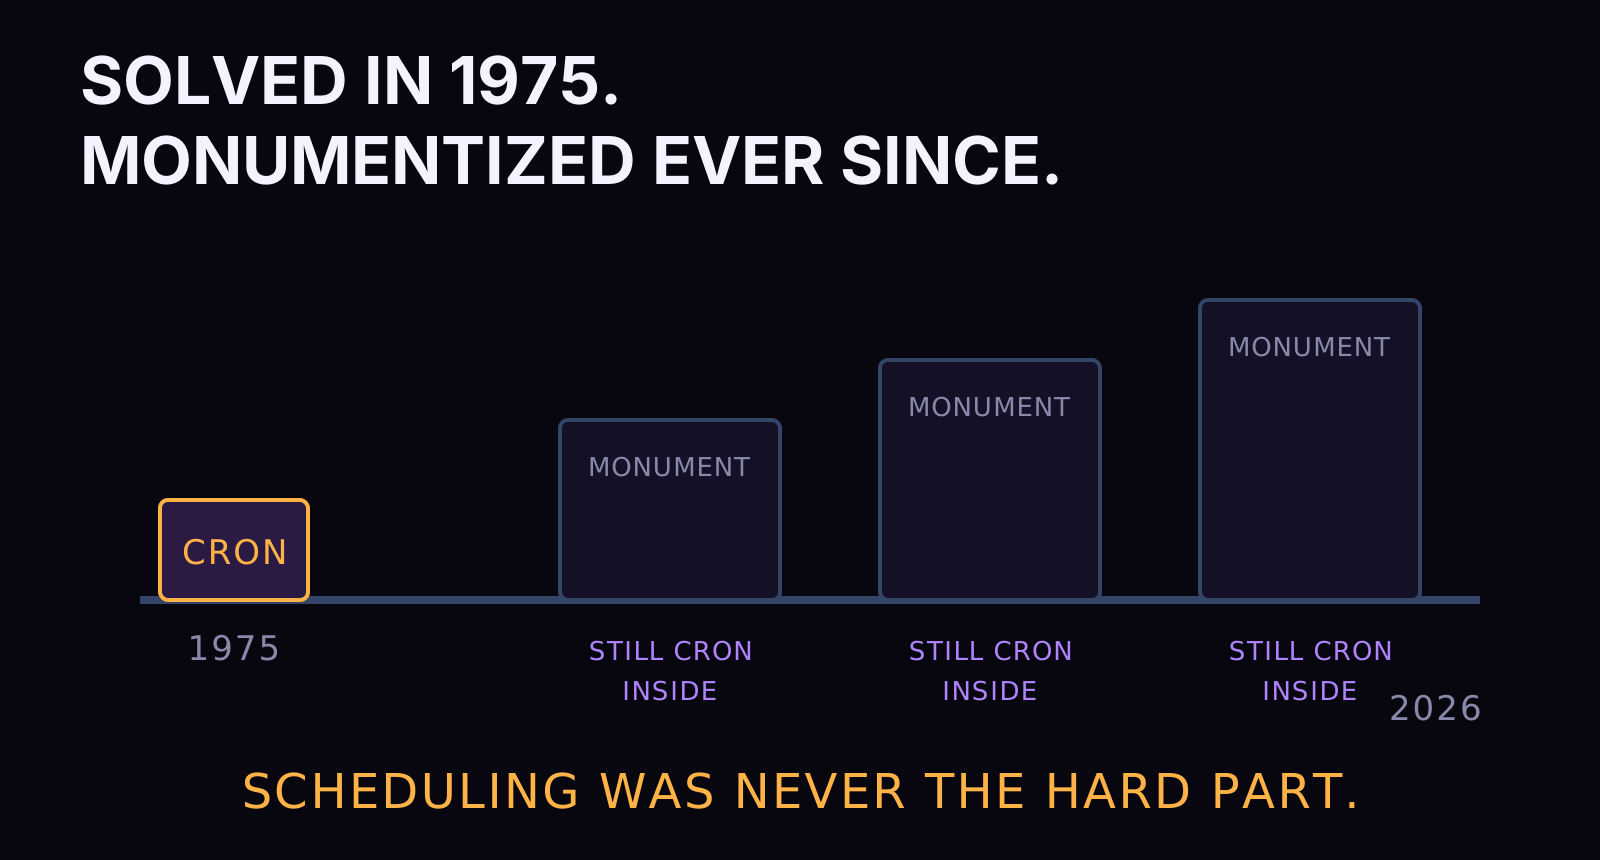
Take scheduling first, because it's the primitive with the biggest reputation and the smallest substance. Cron solved time-based scheduling in the seventies, and every platform I've ever deployed still exposes a cron string as the interface. Event-based triggering is a webhook or a database hook. On this stack, Convex cron schedules cover both jobs with a function call. Scheduling was never the hard part, and a whole product category has been wearing it as a costume.
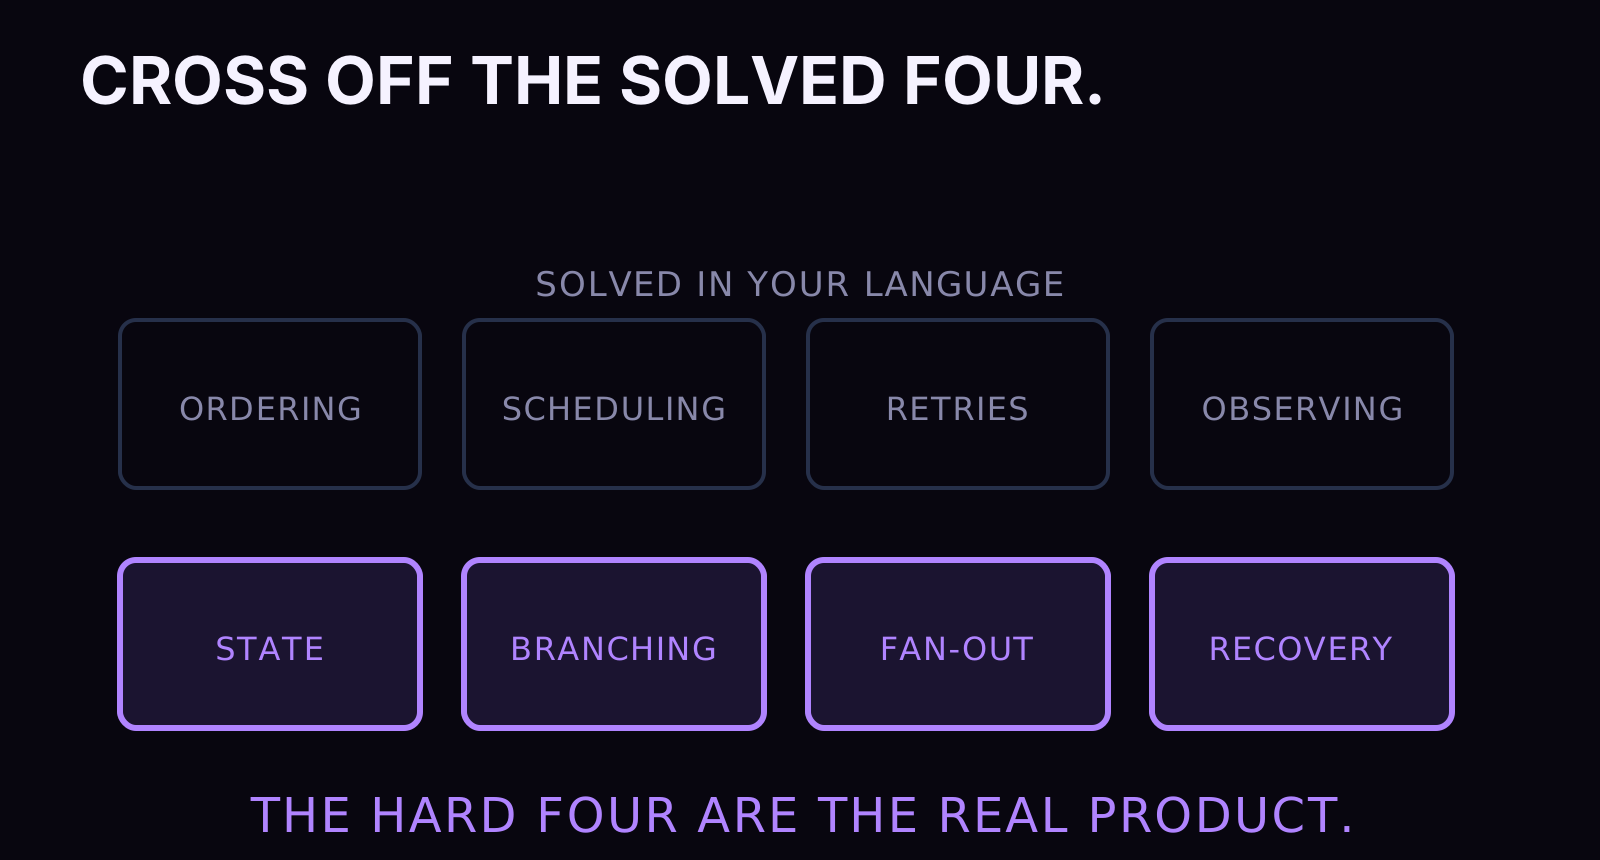
Retries are a decorator or a try loop with backoff, and they've been a solved library problem in every language for years. Observability, on my stack, is structured tracing with spans on every function that does I/O, which is a stronger answer than a run-list UI because you can query it. Dependency ordering is function composition: B takes A's output as an argument, and the program's own control flow is the DAG. Cross those four off the table and look at what's left, because what's left is the real product.
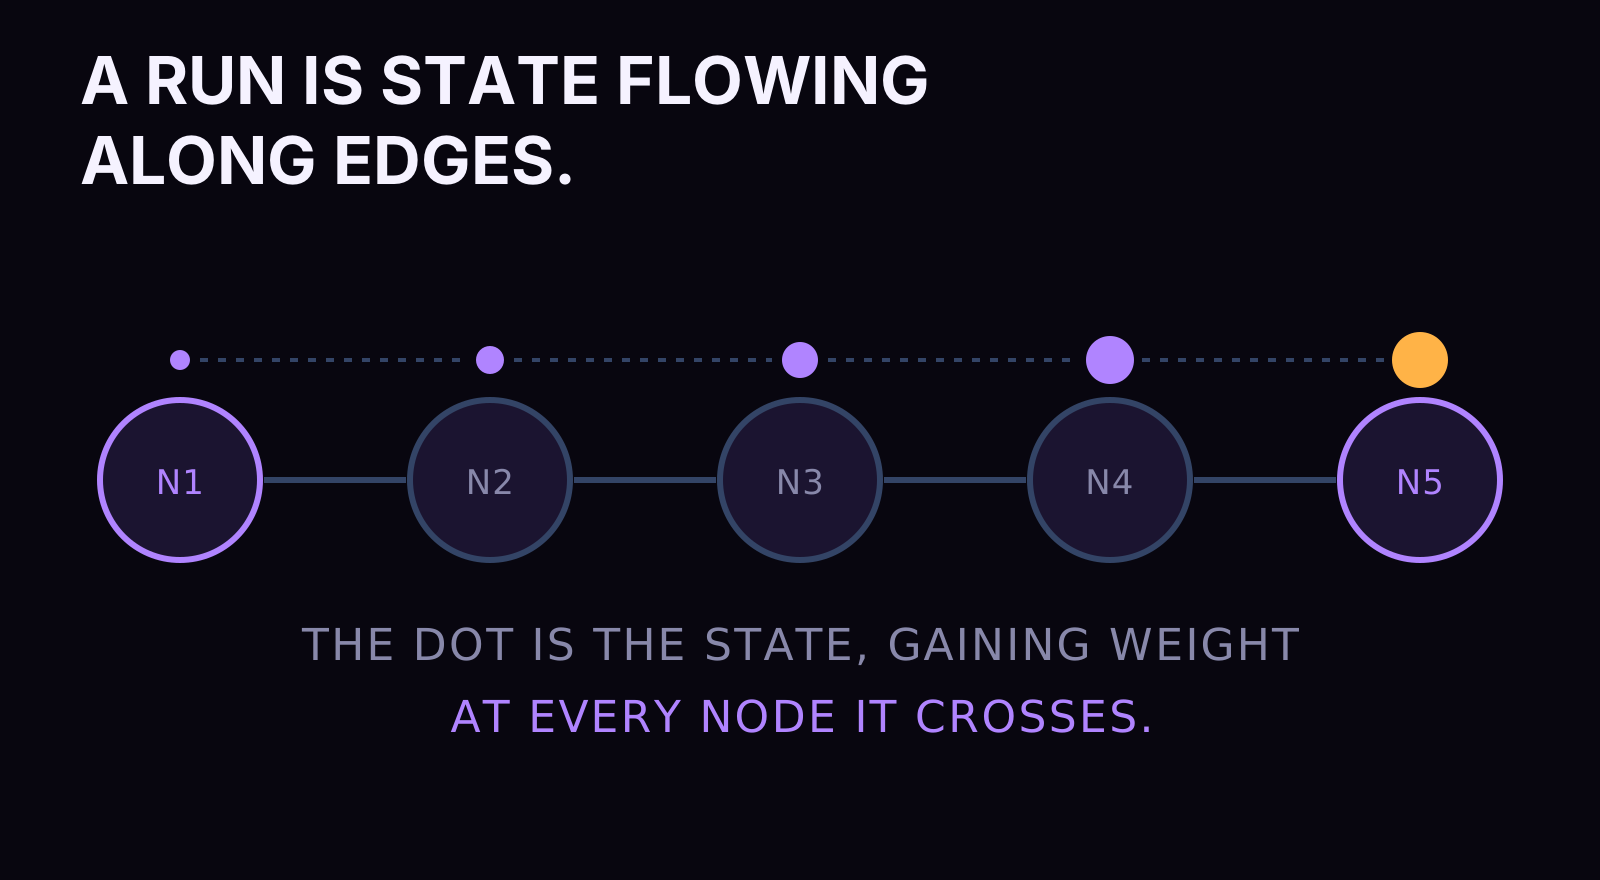
State passing, branching, fan-out, and recovery. Those four are genuinely hard to hand-roll well, and they're the four that kept me paying the platform tax long after I'd stopped believing in the rest of the bundle. Hand-rolled state passing rots into a shared dict that every function mutates and no one types. Hand-rolled branching rots into nested ifs that nobody can draw afterward. Hand-rolled fan-out means touching a thread pool or an async gather, plus the merge logic, plus the partial-failure story. And hand-rolled recovery means building a checkpoint store, which is a real project, which is why almost nobody does it and most "recovery" is rerunning the whole thing and hoping it's idempotent.
Observability you can query beats a run list you can scroll
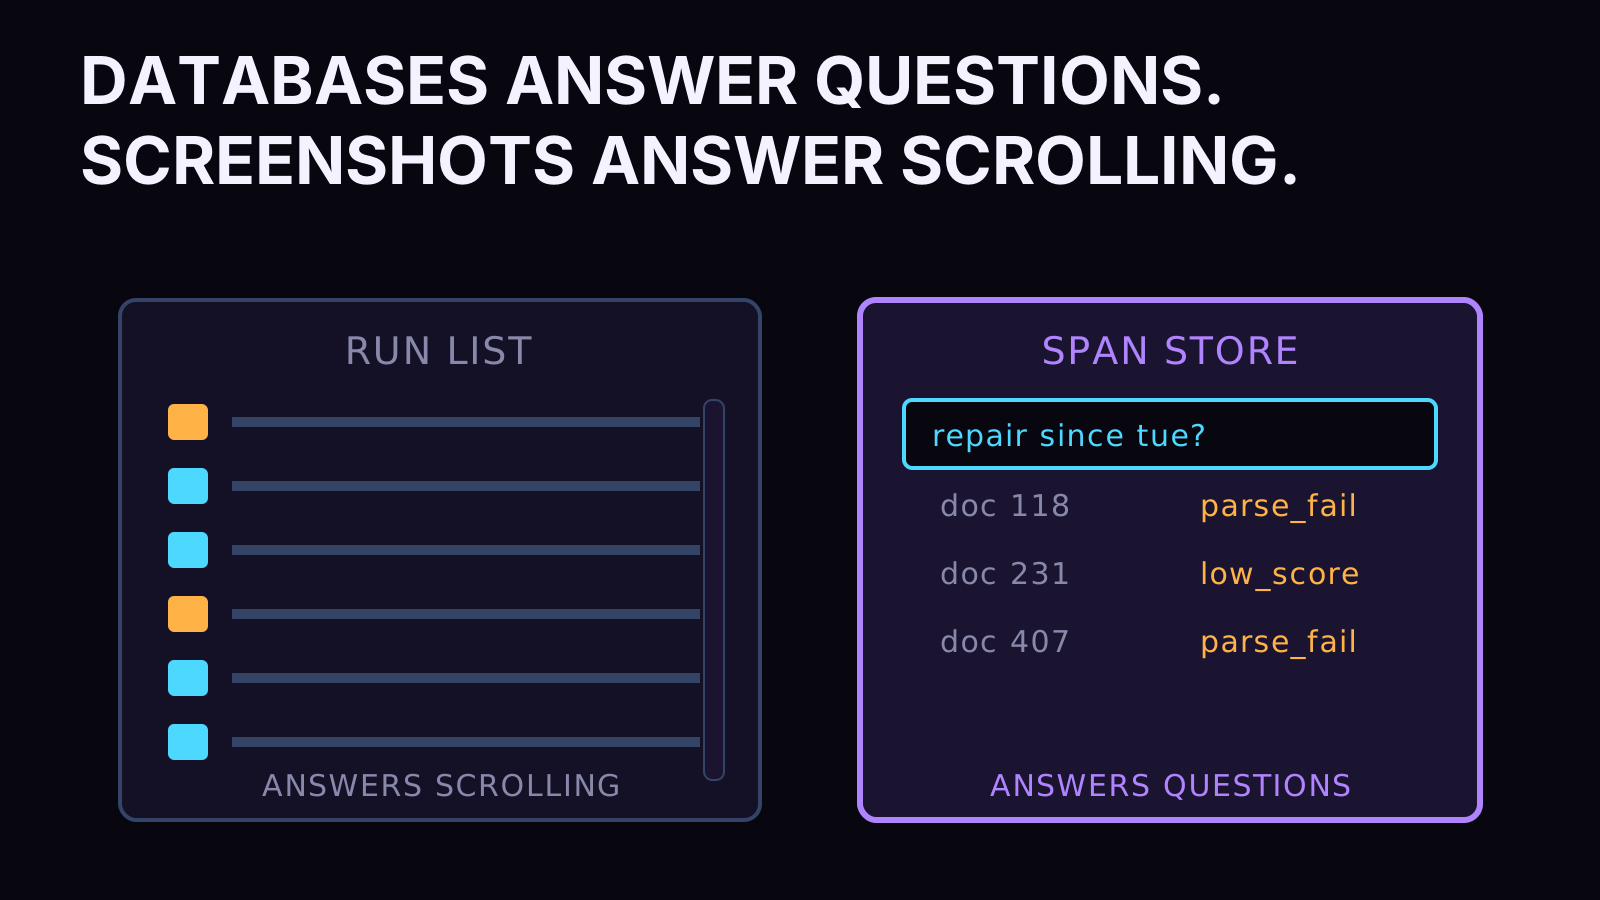
Since I crossed observability off the platform list in one sentence, let me pay for the crossing. The platforms' observability story is a run list: colored rows, a click into a task, a log tail. Fine for answering "did last night run." Useless for answering the questions that decide incidents: which documents took the repair path this week, what's the failure rate on this source since Tuesday, did latency shift after the model swap. My pipelines emit structured spans instead, one per unit of I/O, carrying behavioral attributes: the document ID, the route taken, the score that decided it, the error class when there was one. A span store is a database of what happened, and databases answer questions; a run list is a screenshot of what happened, and screenshots answer scrolling. The company law I run on this is blunt enough to print: if it's not in the traces, it didn't happen.
The backfill question, answered by the same anatomy
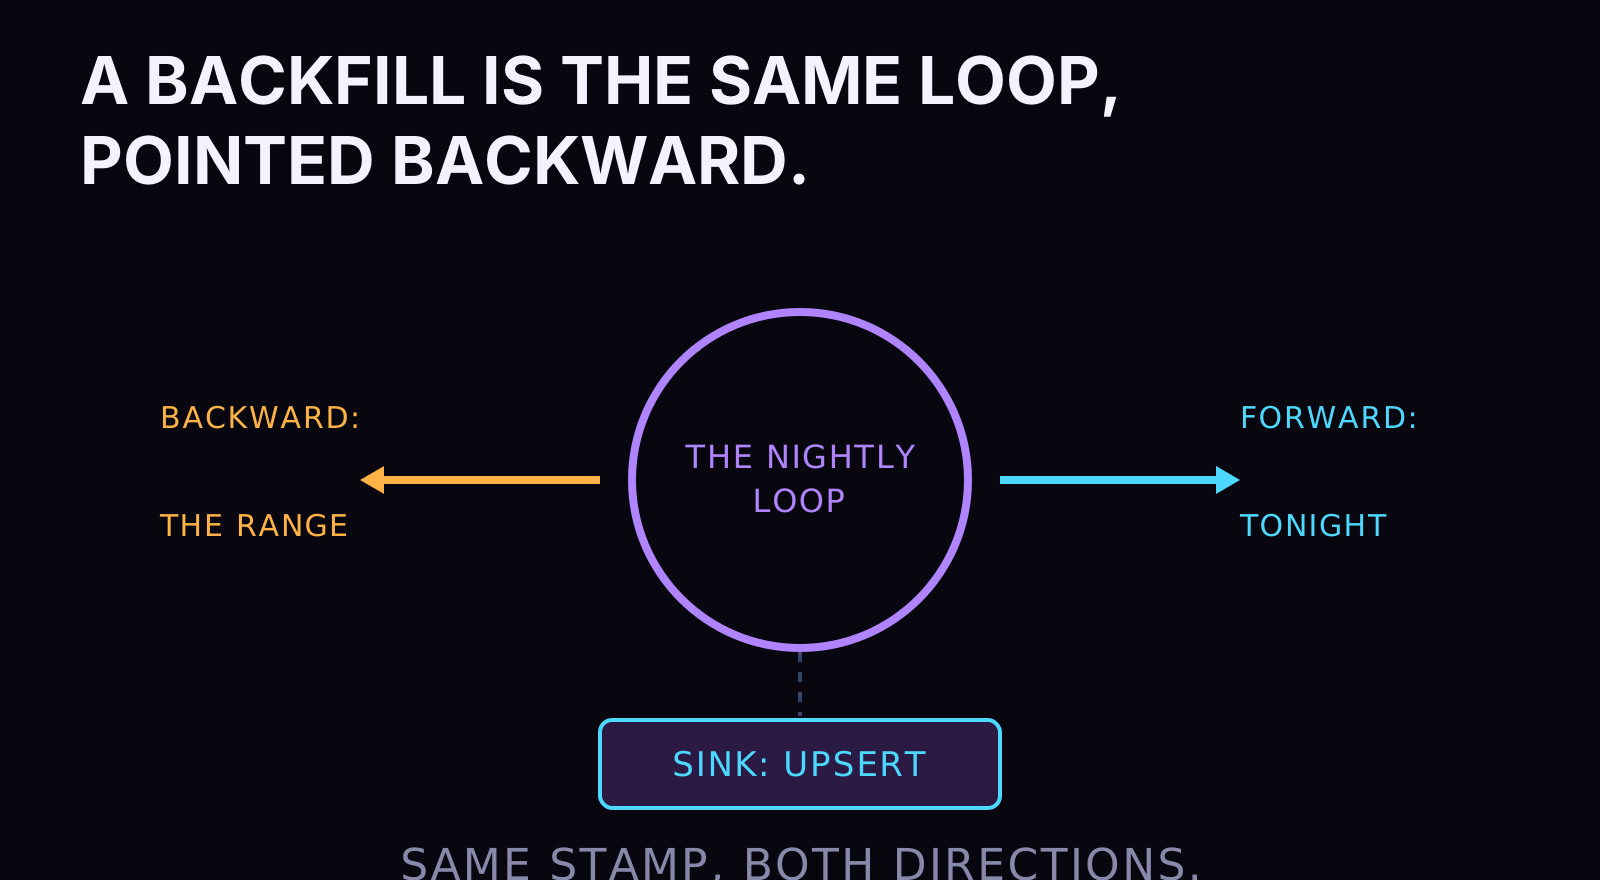
Data engineers reading that table will notice one word missing, because it's the word that justifies half the platform renewals: backfills. Rerunning history through changed logic after a bug fix or a schema change. It looks like a ninth primitive, and it decomposes like the other eight: a backfill is ordinary fan-out over a date range or an ID range, plus idempotent writes at the sink. The platform version gives you a button and a progress bar; the program version gives you the same loop you run every night, pointed backward, writing upserts it was already writing. The button was never the hard part. Idempotency was, and idempotency has always lived in your code, not in the platform, no matter what the platform's marketing implied about handling it for you.
Retries, paid for the same way
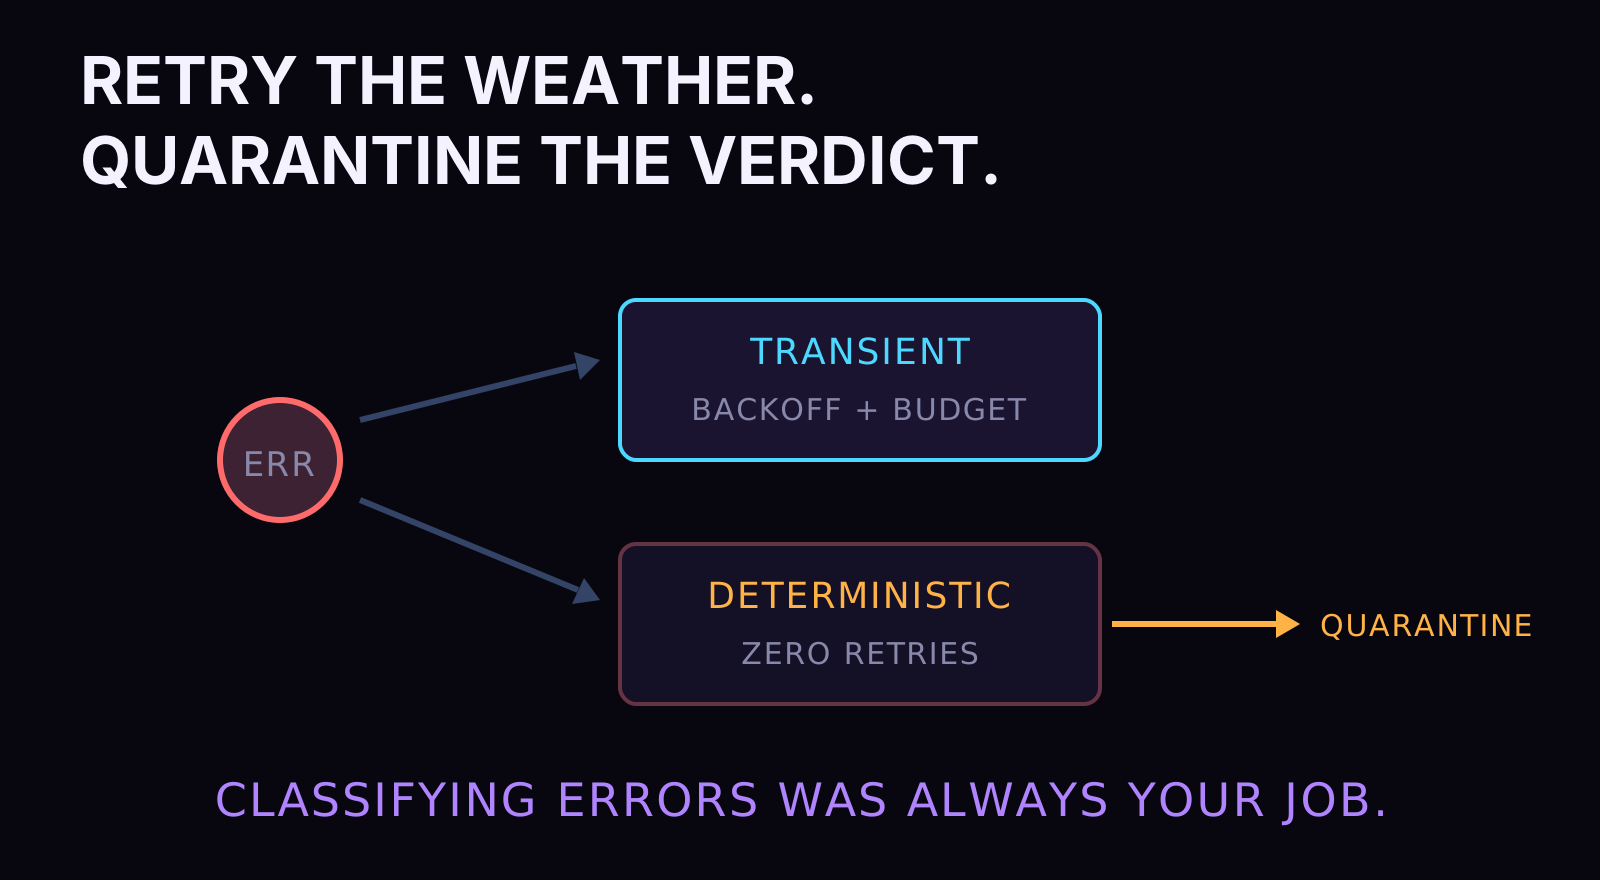
Same debt, same payment: I crossed retries off in a clause, so here's the fuller accounting. The library version is a decorator with backoff and jitter, plus the one design decision the platforms never made for you anyway: classifying your errors. A timeout deserves another attempt; a validation failure deserves zero, because retrying deterministic rejection is how a pipeline melts a rate limit while accomplishing nothing. That classification is domain knowledge, it lives in your code under any architecture, and once it's written the retry machinery around it is a solved-library problem. What changes on a graph is the unit of retry. A platform retries tasks because tasks are what it can see. A checkpointed graph retries from state: the failed node re-executes against exactly what the run knew, and anything downstream of a gate never re-runs at all. Retry scope follows state scope, which is finer, cheaper, and precise about what failed.
A DAG as a deployment artifact was the original mistake
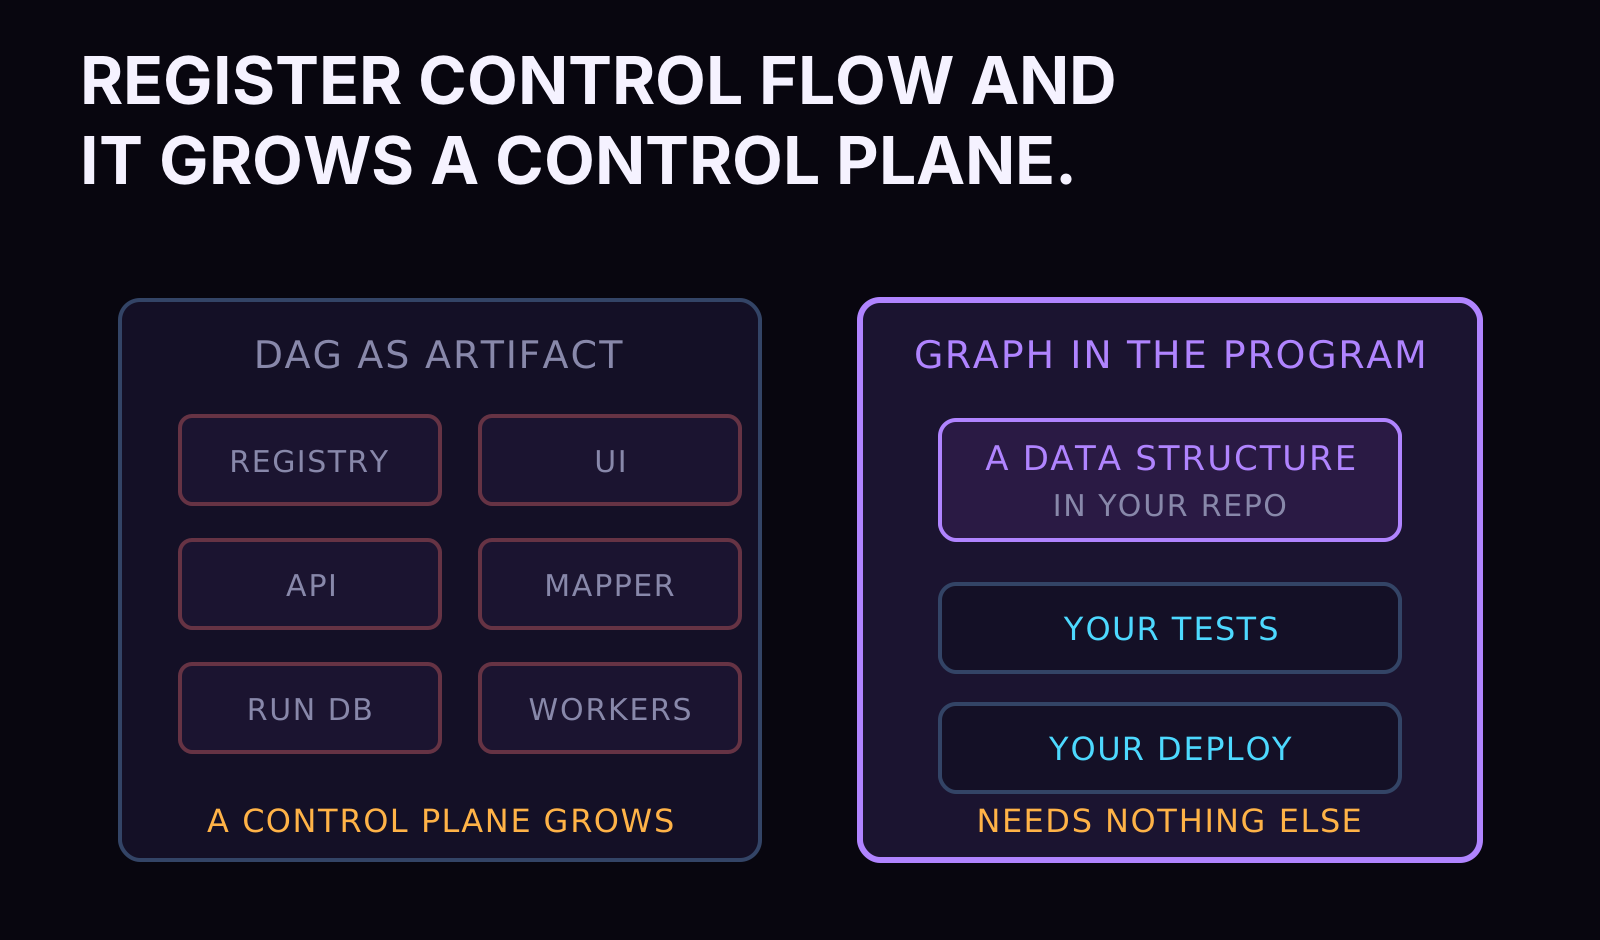
Step back and ask where the platform gravity came from in the first place, because the answer names the thing this whole note is undoing. The platforms made the DAG a deployment artifact: a definition file, registered with a server, versioned and released on the server's schedule, executed by the server's workers. The moment your control flow lives in a deployment artifact, everything around it needs machinery: a UI to see it, an API to trigger it, a mapping feature to widen it at runtime, a database to remember what it did. Control flow that lives in your program needs none of that, because your language already has functions, ifs, and loops, and your process already executes them. The graph library doesn't reintroduce the artifact; the graph is constructed by your code, in your repo, tested by your tests, deployed when your app deploys. It's a data structure, and data structures don't need control planes.
So here's the reframe that the rest of this note builds on. The question the aisle wants you to ask is "which orchestration platform should we adopt?" The min-max question is different: which of the eight primitives do my programs still lack, and what's the smallest thing that provides exactly those? For me the answer was the hard four: state, branching, fan-out, recovery. And the smallest thing that provides exactly those turned out to already be sitting in my Python environment, wearing an AI costume, getting used for agents while its documentation never once mentions the words "data engineering."
Ask which primitives your programs lack, and what's the smallest thing that provides exactly those.
IV. State is the half of data engineering nobody bills for
The library is LangGraph. If you've heard of it at all, you've heard of it as an AI agent framework, which is true the way a truck is a cupholder. What LangGraph provides, stated without the branding, is this: you define a typed state object, you define nodes as plain functions that read that state and return updates to it, and you wire the nodes into a graph. That's a workflow engine. The agent part is optional cargo. Everything I use it for in this site's pipelines would work if large language models didn't exist.
Start with the state, because the state is the whole game. Half of data engineering, the half that never shows up on an invoice, is deciding how intermediate results move between steps without decaying into garbage. Every veteran has met the failure form: a dict named context or payload that every function mutates, no record of who writes which key, and a 2 a.m. debugging session that starts with printing the whole thing to find out what's actually in it. Untyped shared state is the original sin of hand-rolled pipelines, and it's the reason the platform tax felt worth paying.

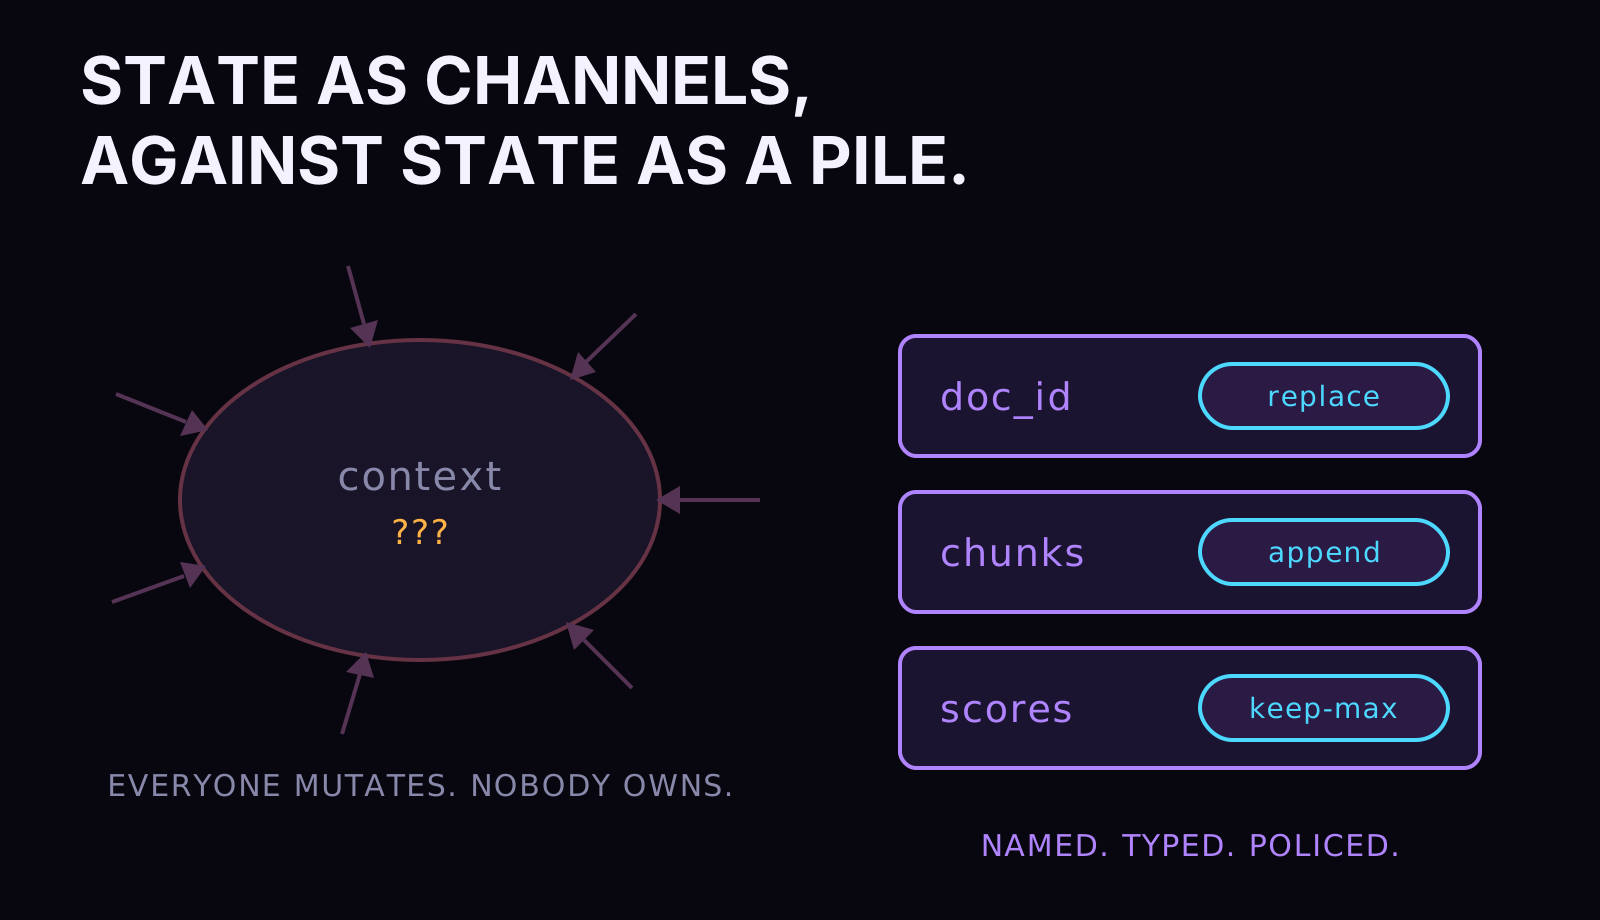
LangGraph makes the state a declared, typed schema. Every channel in it is named, every node's return is an update to named channels, and each channel can carry a reducer: a function that defines what "two writes to this key" means.
from operator import add
from typing import Annotated
from typing_extensions import TypedDict

class PipelineState(TypedDict):
    doc_id: str                      # last write wins
    chunks: Annotated[list[str], add]  # concurrent writes append
Two lines of typing, and the semantics of concurrent writes are now a decision you made instead of an accident you'll discover. The engine's contract, straight from the docs: when a node returns an update, the new value for each key is reducer(left, right), where left is the current state and right is the node's update. No reducer means replace. A reducer means merge, your way. If you prefer Pydantic models over TypedDict for state, that's supported too, with runtime validation on every update, which is exactly where my Pydantic-as-IR habit wants to live.
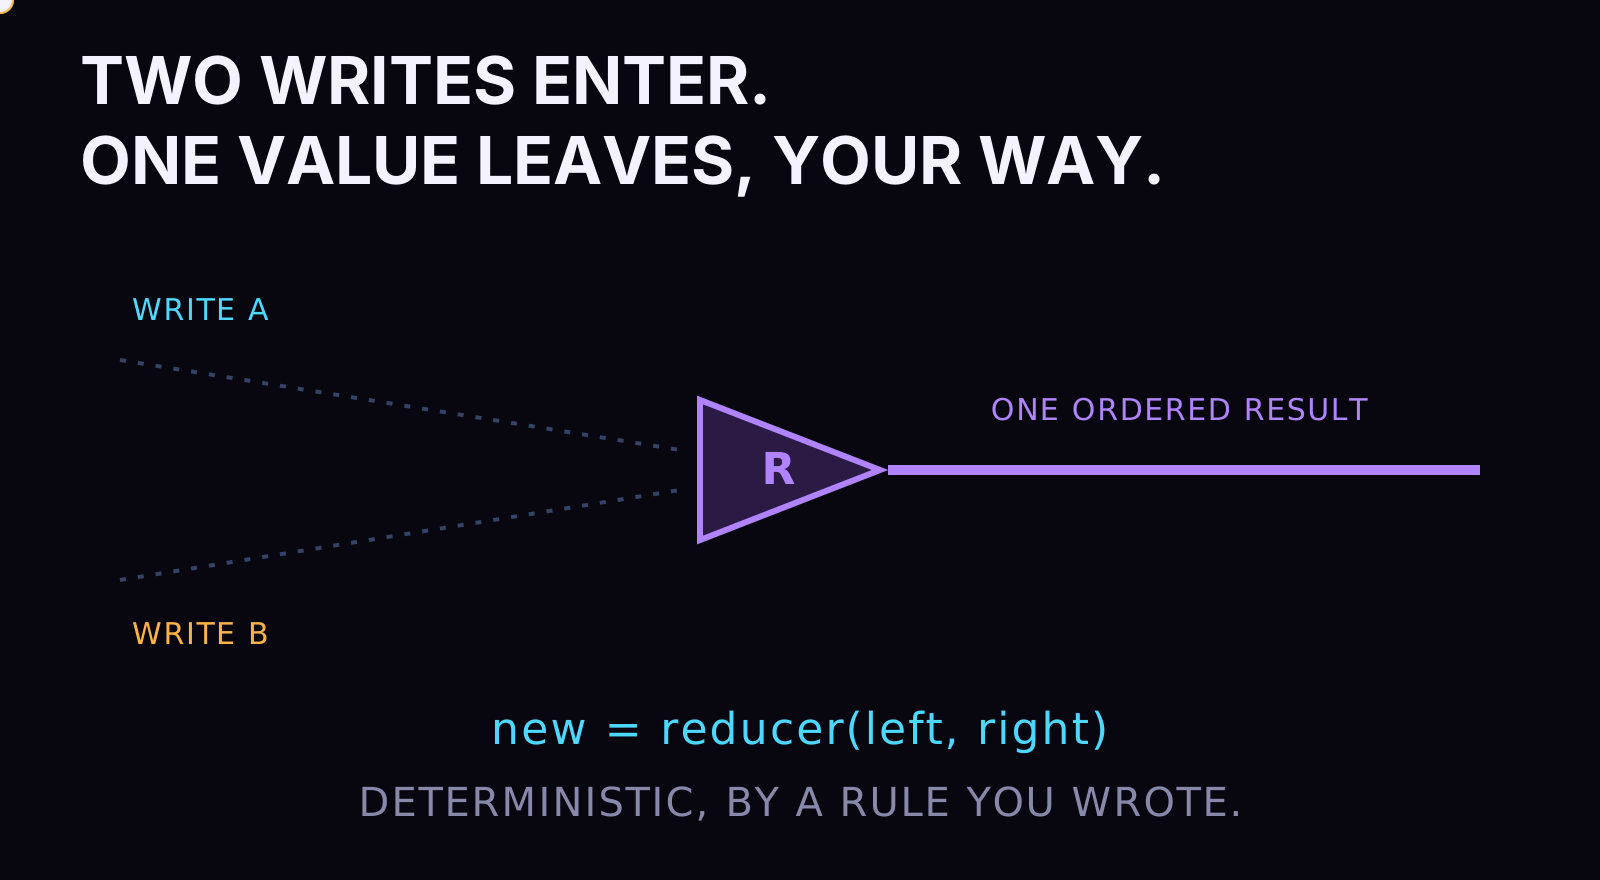
I said reducers were half the reason I trust this library with pipeline work, and I'll say the caution out loud too: programmatic state updates are dangerous if you don't know what you're doing, and a serious capability if you do. A reducer is a place where merge policy lives as code. Appending lists, deduplicating by key, keeping the max score, folding partial results into a running aggregate: those are the exact decisions that hand-rolled pipelines bury in whichever function happened to write last. Here they're declared once, on the channel, where every node inherits them and none can bypass them.
A worked example: dedupe is a merge policy wearing a job title
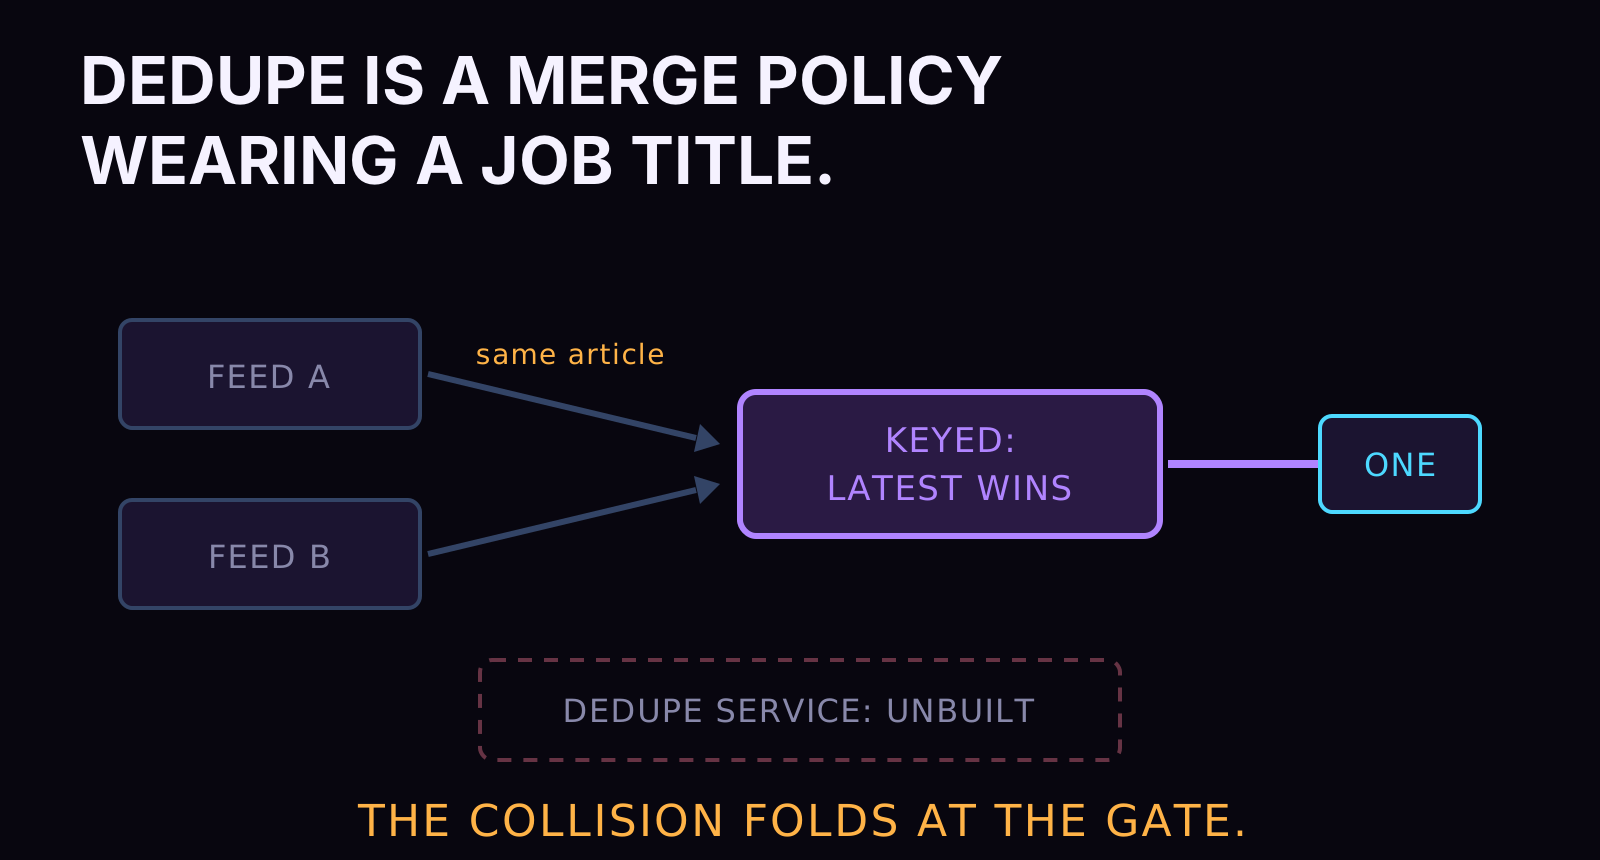
Make the reducer idea concrete with the least glamorous job in data engineering. Every real corpus produces duplicates: the same article ingested from two feeds, the same entity extracted by two passes, the same record arriving twice because a source hiccuped. The traditional answer is a dedupe stage, a whole step in the pipeline with its own logic and its own bugs. The reducer answer dissolves the stage into a policy on the channel: entities are a dict keyed by canonical ID, and the reducer for that channel says keyed-latest-wins, or keep-highest-confidence, whichever the domain wants. Duplicates stop being an event you handle and become an input the merge rule was always expecting. Two feeds write the same article; the reducer folds them; downstream never learns there was a collision. The dedupe stage you didn't build joins the refused-parts list from chapter two, and the shape of the win is identical: a standing job absorbed by a declaration.
Pydantic-as-IR: the state is a contract, not a container
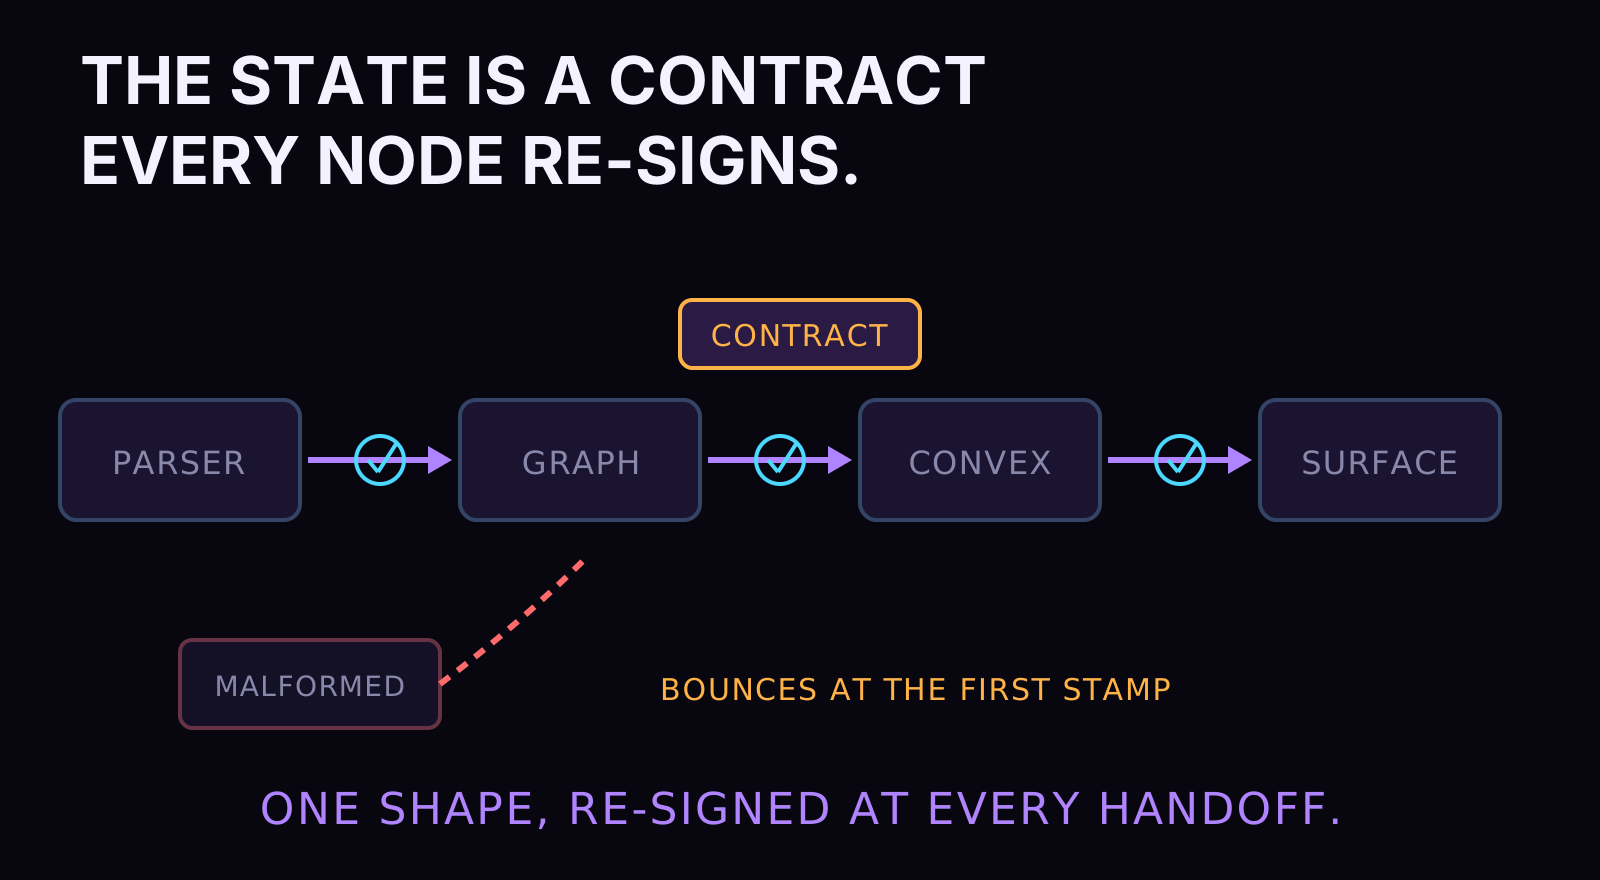
I run one discipline underneath all of this that predates my LangGraph adoption and explains why the library fit so cleanly: every piece of structured data in my systems is a Pydantic model, and the models are the intermediate representation the whole operation compiles through. A document enters as a model, gets chunked into models, scored into models, and lands in Convex as the serialized form of a model whose fields the TypeScript surface types against. One declared shape, enforced at runtime, from first parse to final render. Compilers earned the world's trust by refusing to pass malformed structures between passes; a data operation deserves the same constitution. So when the graph state is itself a validated model, the workflow engine joins an existing chain of custody instead of punching a hole in it. The state isn't a bag the pipeline carries. It's a contract every node re-signs.
Pause is a primitive too
Durable state buys one more thing before we get to recovery, and it's the feature the agent world calls human-in-the-loop while the ops world calls it an approval flow. Because the whole state checkpoints, a graph can stop at a designated point, hold indefinitely, and resume when someone answers. Stop means genuinely stop: no process waiting, no worker held hostage, nothing running. The state sleeps in the checkpoint store until the human weighs in, then the run continues as if the pause were an instant. Every pipeline that needs a person in the middle, a review before publish, a sign-off before an expensive step, a judgment call on ambiguous input, gets that for free from the same persistence layer that does recovery. Teams bolt entire ticket systems onto their orchestrators to fake this. Here it's the checkpointer, doing its one job in a second costume.

Now the recovery primitive, because this is where the argument stops being about ergonomics and starts being about the tooling class. LangGraph compiles a graph with a checkpointer: an object that snapshots the entire graph state automatically as execution proceeds, keyed by a thread ID.
from langgraph.checkpoint.postgres import PostgresSaver

with PostgresSaver.from_conn_string(DB) as checkpointer:
    checkpointer.setup()          # first run only: creates the tables
    graph = builder.compile(checkpointer=checkpointer)

    config = {"configurable": {"thread_id": "ingest-2026-08-09"}}
    result = graph.invoke({"doc_id": "field-note-42"}, config)
Read what that buys as a data engineer, without any agent framing. Every run of every pipeline now has a durable, queryable history of its state at every step. A run that dies at node four resumes from node four, with the state it had, because the checkpoint holds it. The docs call the use cases conversation memory and human-in-the-loop; the use case I care about is the one every orchestrator sells as its crown feature: fault tolerance, recovery, and the ability to answer "what exactly did this run know when it made that decision." The workflow database you used to operate as a separate service, the one holding run state and task instances and retry bookkeeping, has become a compile argument. In development it's an in-memory saver. In production it's a Postgres table.
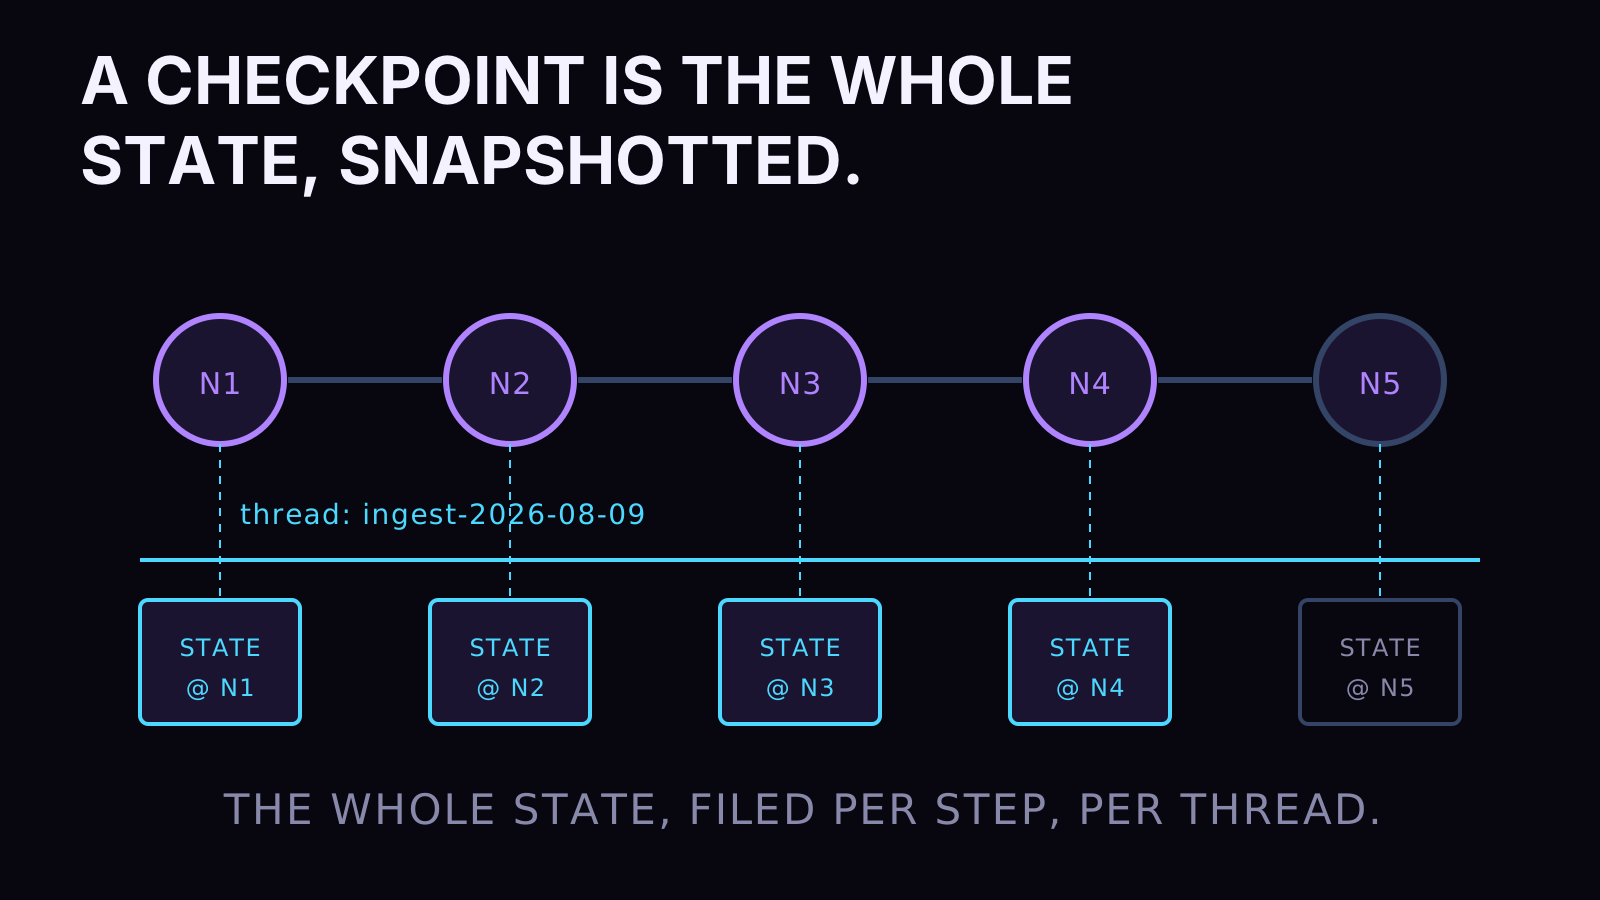
The resume story deserves to be felt rather than described, because rerun-from-zero is the tax everyone has normalized. An embedding pipeline that dies on document 900 of 1,000 and restarts from document one hasn't failed once, it has failed 900 times and billed you for each. Step through what the checkpoint changes:
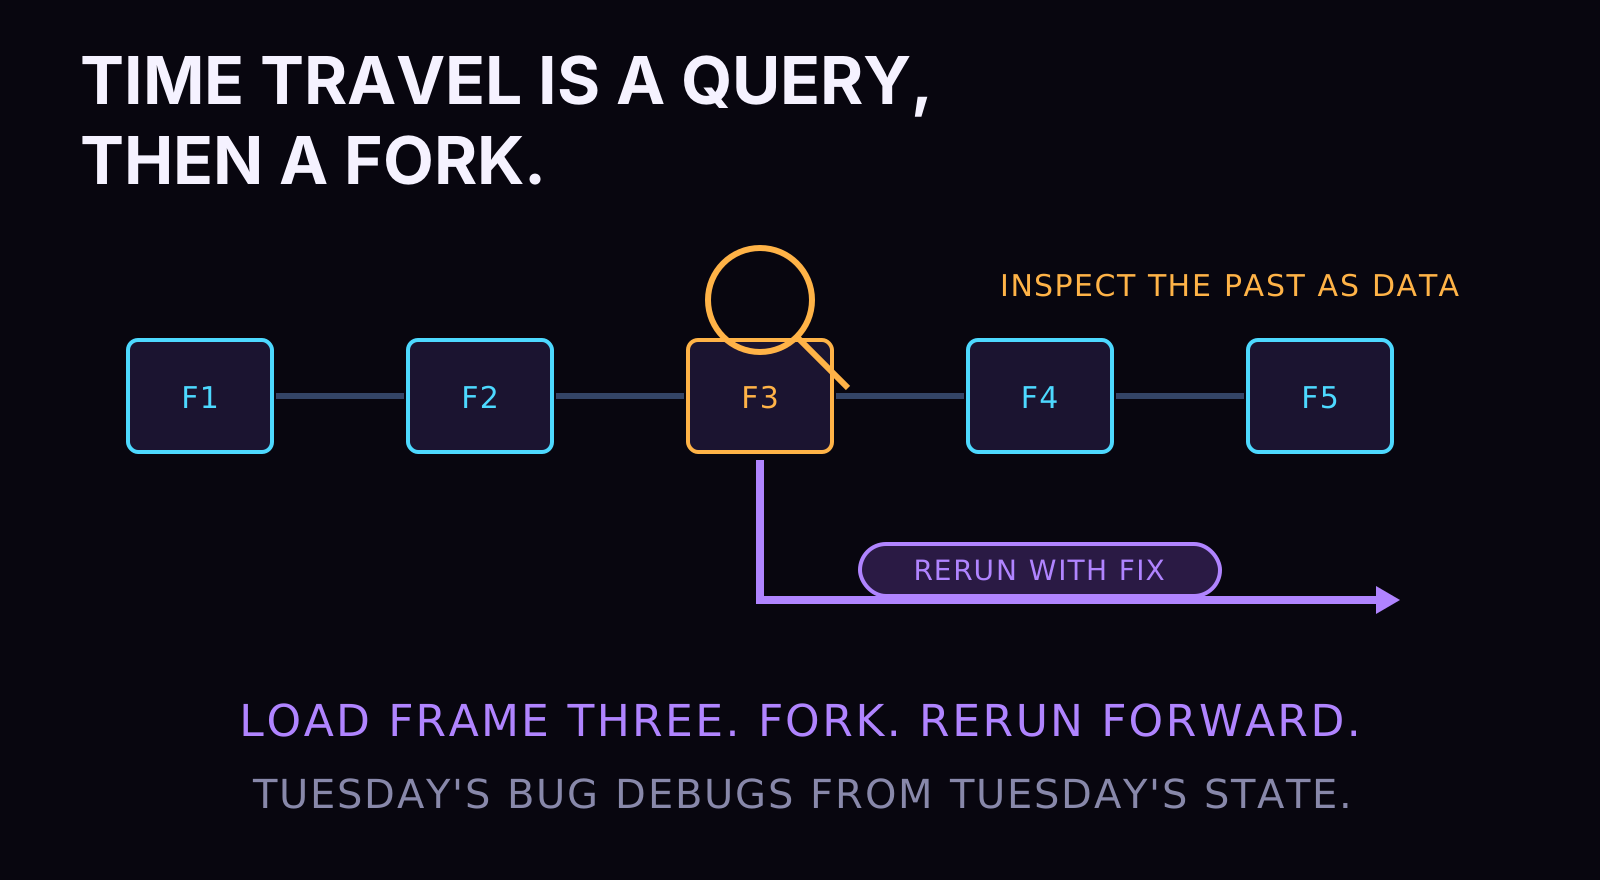
And because checkpoints are data rather than logs, you get the orchestrator's other premium feature as a query: time travel. Load the state as it stood at step three, inspect it, fork it, rerun from there with a fix. When a pipeline produced a weird artifact on Tuesday, the debugging session starts from Tuesday's actual state instead of from a reproduction attempt. Every data engineer who has tried to reconstruct "what did the job see" from log lines knows what that's worth.
The whole engine in one screen of code
Before the cost accounting, see the pieces assembled, because the assembled size is itself an argument. Here's a real pipeline shape, condensed but structurally complete: typed state with a merge policy, two worker nodes, a quality gate, dynamic fan-out, and durable execution. Count the concepts against chapter three's hard four as you read.
class State(TypedDict):
    docs: list[Doc]
    chunks: Annotated[list[Chunk], add]   # fan-in policy
    score: float

def fan(state: State):
    return [Send("process", {"doc": d}) for d in state["docs"]]

def gate(state: State) -> str:
    return "publish" if state["score"] >= floor() else "repair"

builder = StateGraph(State)
builder.add_node("ingest", ingest)
builder.add_node("process", process)
builder.add_node("publish", publish)
builder.add_node("repair", repair)
builder.add_conditional_edges("ingest", fan)
builder.add_conditional_edges("process", gate)

with PostgresSaver.from_conn_string(DB) as checkpointer:
    graph = builder.compile(checkpointer=checkpointer)
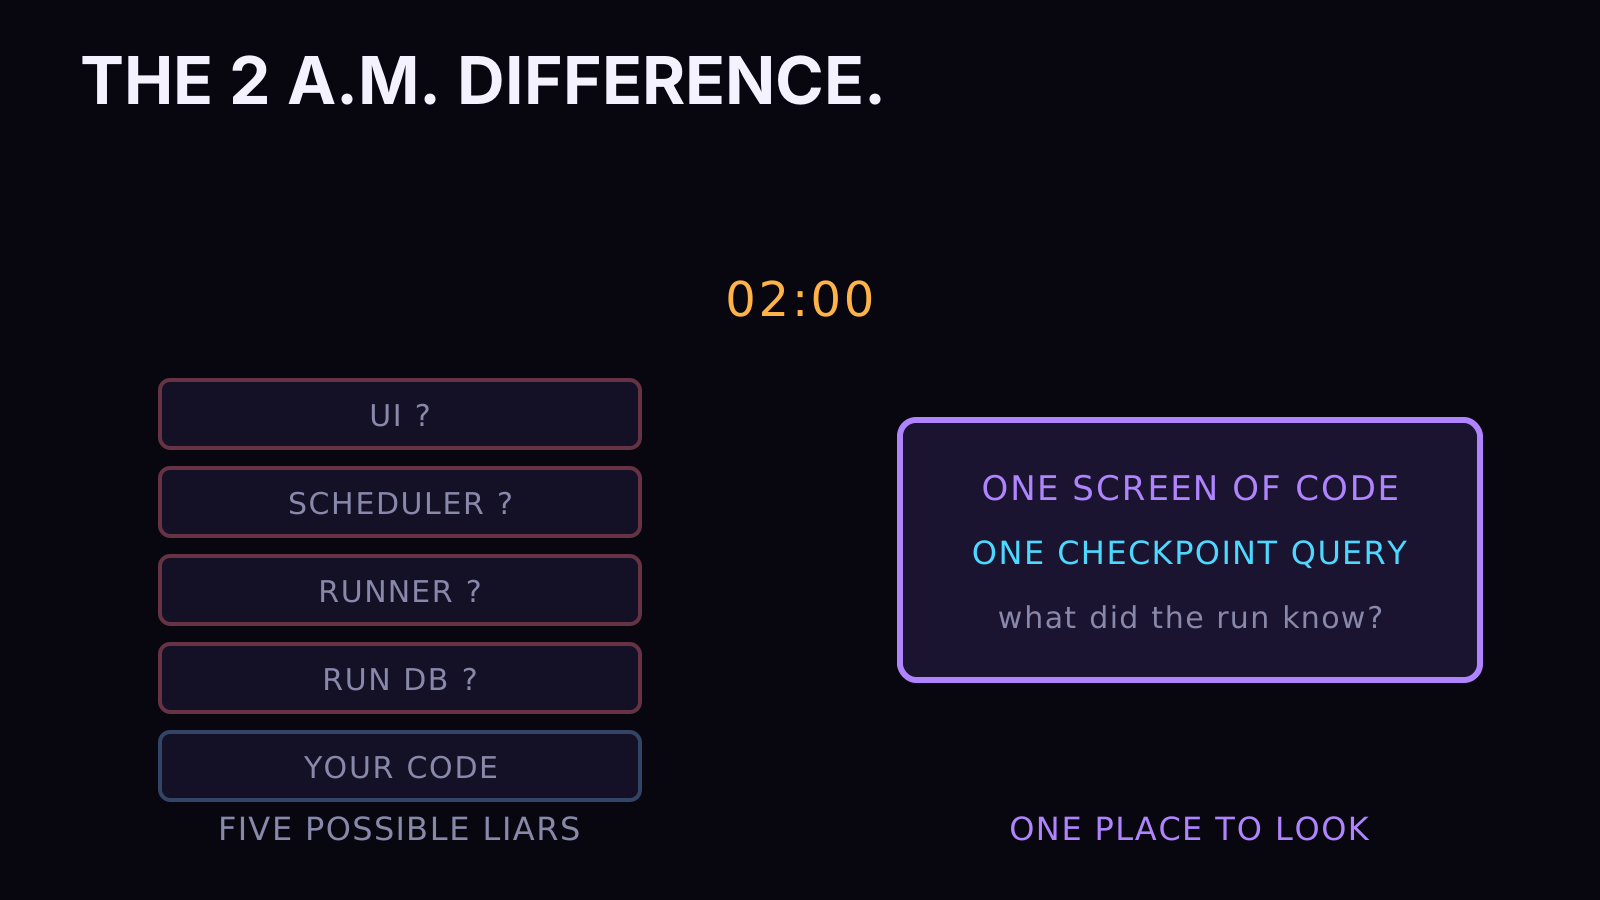
That's the load-bearing part of an orchestrated, gated, fan-out, resumable pipeline, and it fits on a slide without shrinking the font. Everything in it is plain Python a new hire reads without a training course, tests with ordinary tests, and steps through with an ordinary debugger. When the entire coordination layer of your data operation is one screen you can read, the operation has a different risk profile, and the difference shows up precisely at 2 a.m., when reading one screen is about what anyone can manage.
What checkpoints cost, since nothing is free
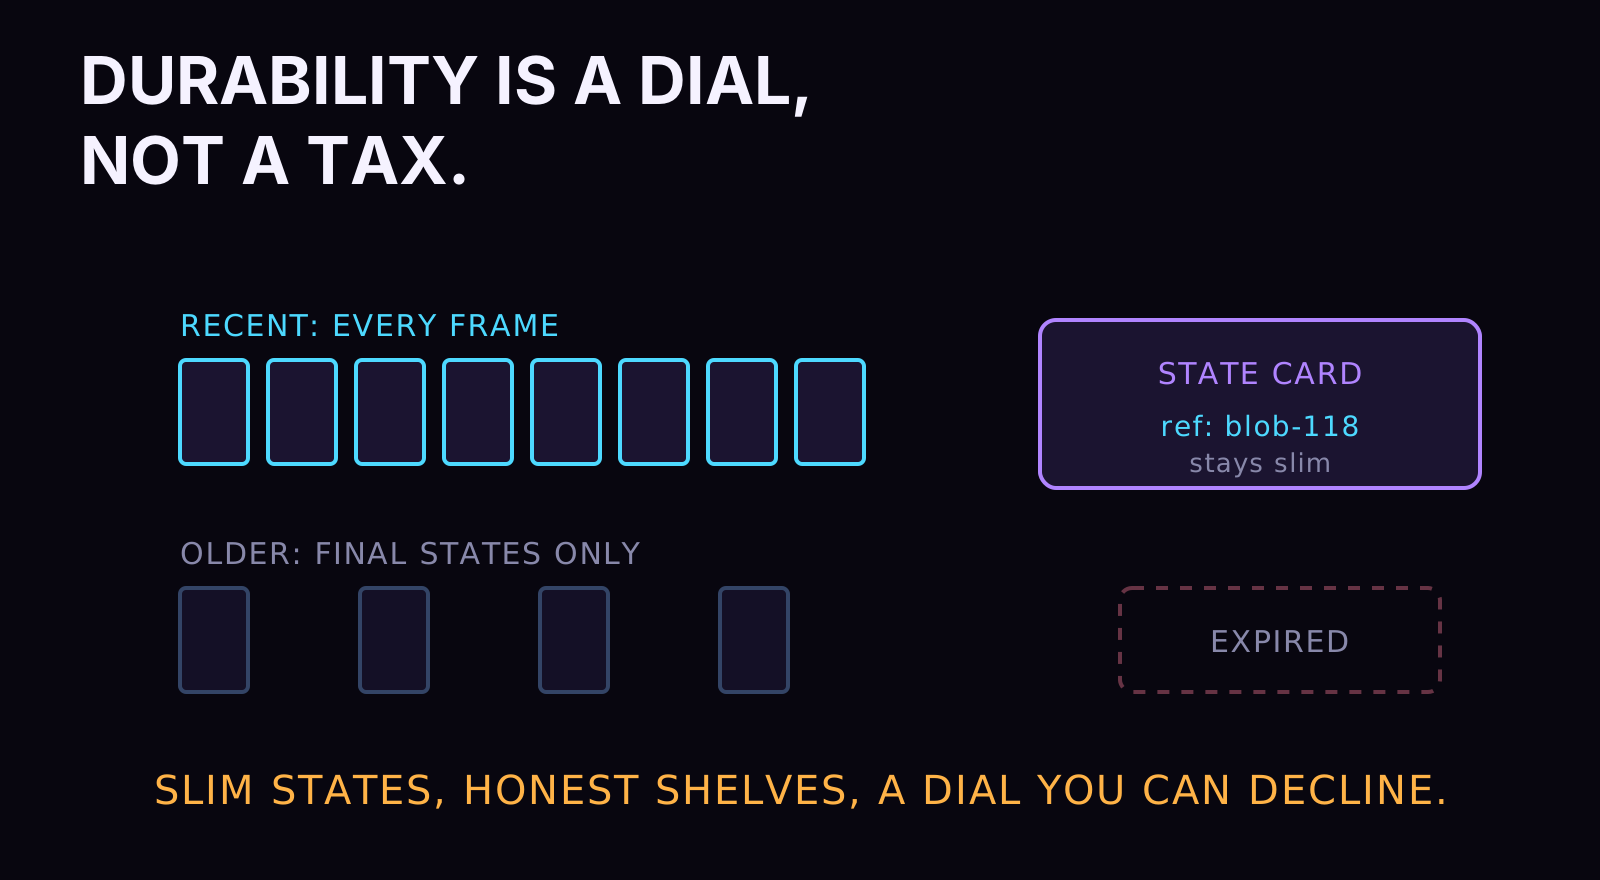
Durable history is storage and write overhead, and pretending otherwise would violate the spirit of this whole note. Every super-step writes a snapshot, so a chatty graph with a fat state generates real rows, and a Postgres table that grows forever is a pager waiting to fire. The mitigations are ordinary engineering: keep bulk artifacts out of the state and pass references instead, so snapshots stay small while the corpus lives where corpora belong; set a retention policy that matches what you'd actually replay, which for most pipelines is days to weeks, plus final states kept longer for the audit trail; and for genuinely throwaway work, compile without a checkpointer at all, because durability is a dial, and a dial you can decline is the difference between a primitive and a platform. The orchestrators never offered that choice; their run database was structural. Here it's an argument you pass, or don't.
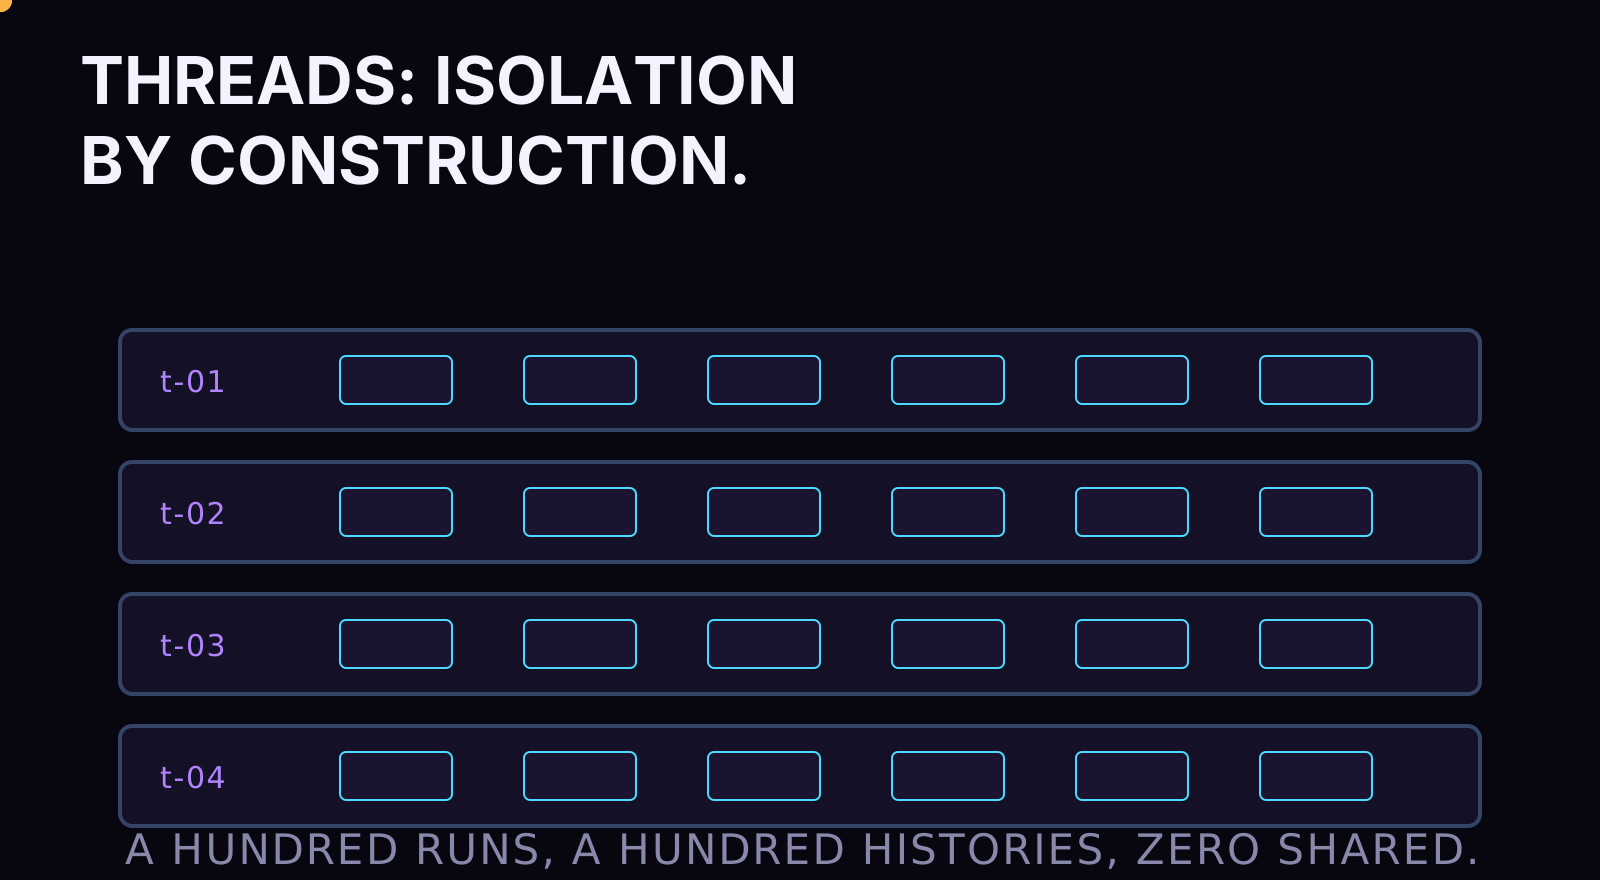
Threads close the chapter. Every run carries a thread ID, and checkpoints are scoped to it, so a hundred concurrent pipeline runs keep a hundred isolated histories with zero shared mutable anything. Concurrency isolation is another line the tooling aisle prints in bold on the box, and here it's a string in a config dict. Notice the shape of this whole chapter: nothing in it was an agent feature. Typed channels, declared merge policy, durable snapshots, resumable runs, forkable history, isolated threads. That's a state layer for pipelines, better than the one inside most orchestrators, shipped as a library while its own marketing talks about chatbots.
V. Conditional edges are guardrails you can program
Branching is the second of the hard four, and LangGraph's version of it is one function with an unglamorous name. A conditional edge is a plain function that receives the current state and returns the name of the next node. That's the whole mechanism. The consequences are bigger than the mechanism, because a function that reads finished work and decides where it goes next is a quality gate, and a quality gate that runs as code runs on every single unit of work, forever, without a meeting.
def route_on_quality(state: PipelineState) -> str:
    if state["extraction_score"] < threshold:
        return "repair"        # try again with the fallback parser
    if not state["entities"]:
        return "quarantine"    # never fake an empty success
    return "embed"             # clean work moves forward

builder.add_conditional_edges("extract", route_on_quality)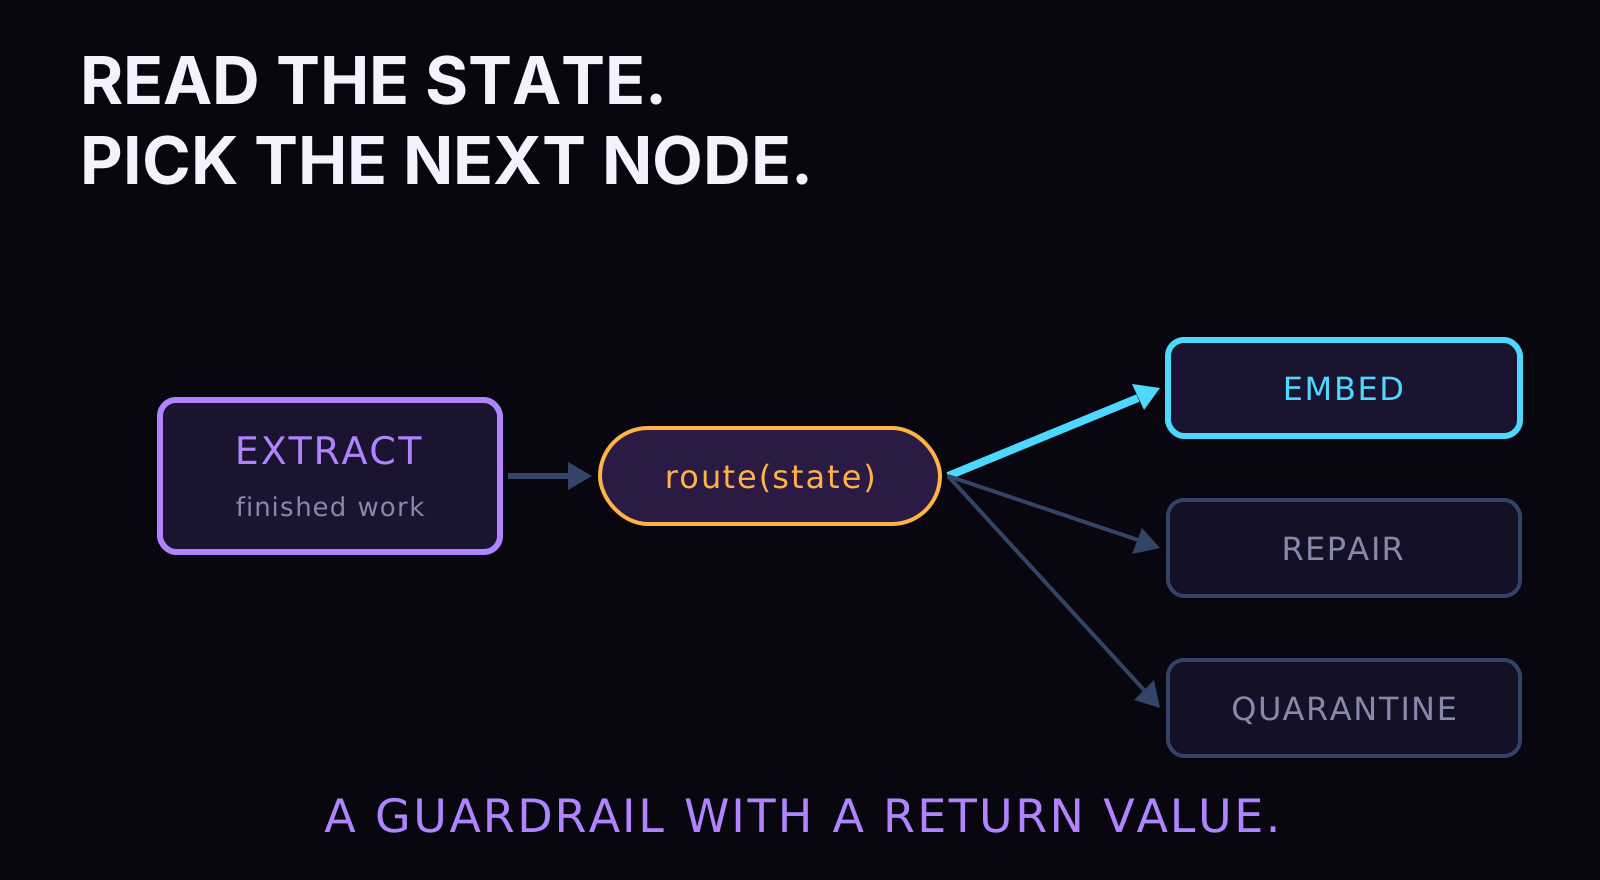
Compare that to how quality control works in most data teams, including teams I've billed. Quality lives in a dashboard. The pipeline runs, results land, a chart drifts, and eventually a human notices and opens an investigation into work that shipped days ago. A dashboard tells you it broke. A gate refuses to let it break. The difference is when the check runs: after the damage is downstream, or before the damage exists. Conditional edges move the check to before, and they price it at the cost of writing down, as one function, what "good enough to continue" means.

Writing that function forces the conversation every pipeline needs and few have: what do we do with work that fails the bar? The lazy answer, the one I treat as a firing offense in my own code, is the silent fallback. The parser fails, someone catches the exception, returns an empty list, and the run reports green while shipping nothing. Silent fallbacks are the most expensive lines in a codebase because they convert loud, cheap failures into quiet, compounding ones. Every downstream step happily processes the empty list. The dashboards stay calm. Weeks later somebody asks why search feels thin, and the investigation has to tunnel through a stack of green checkmarks to find the except-pass that started it.
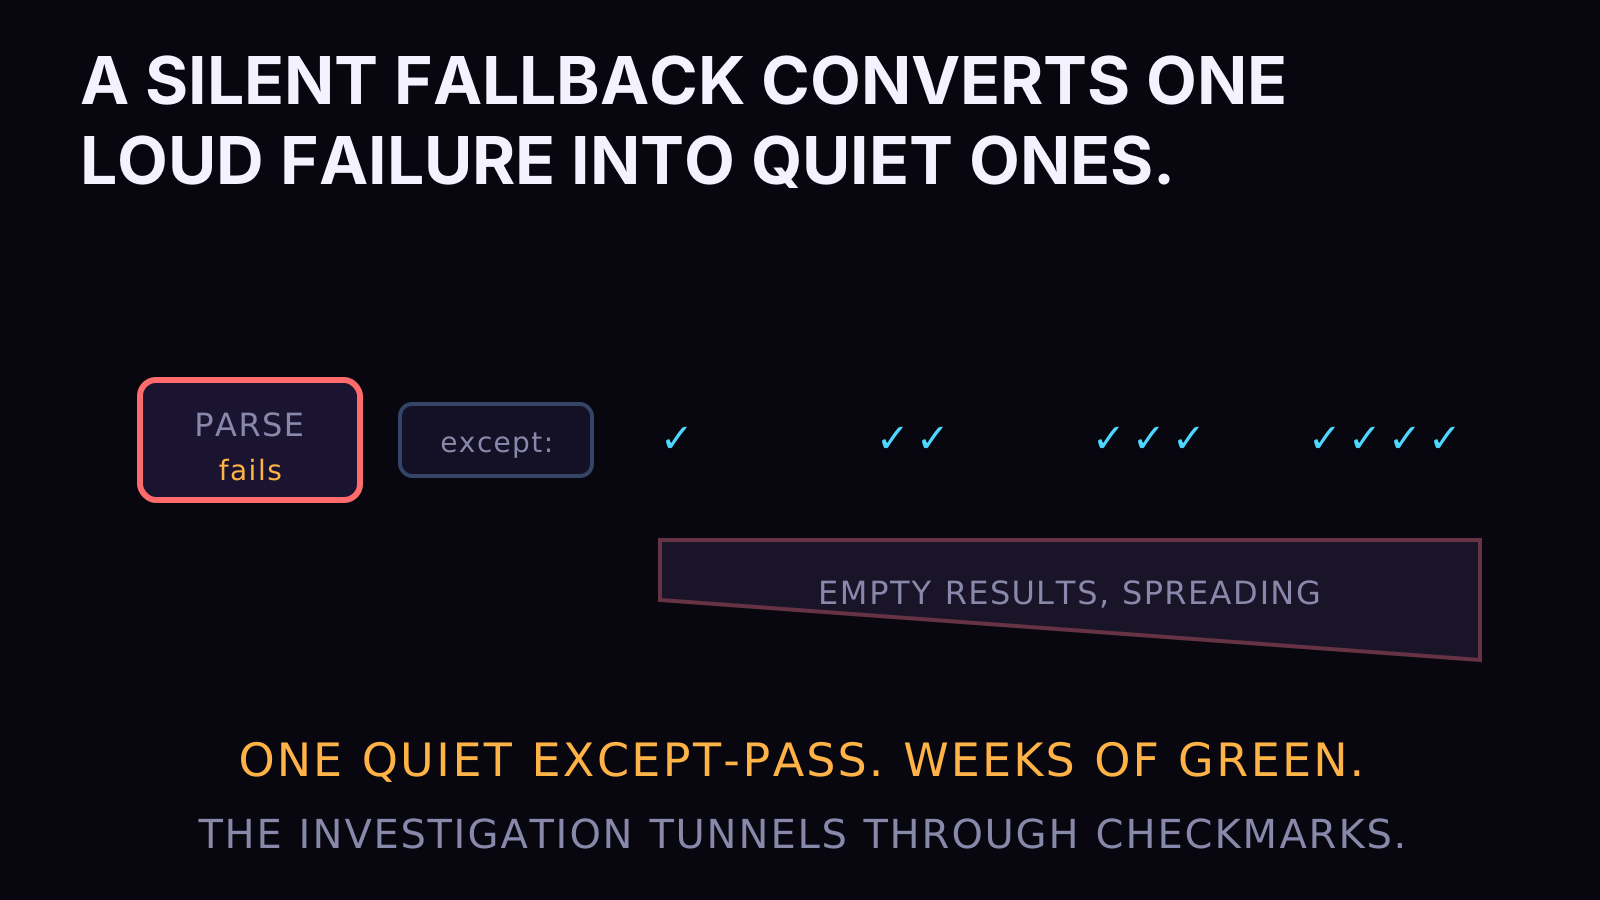
Routing makes the degraded path a first-class citizen instead of a secret. Failed extraction doesn't get to impersonate success; it gets routed, visibly, to repair or quarantine, and the checkpoint records that the run went there. My rule, stated as policy: a degraded path must announce itself. The graph gives that policy a place to live that isn't a code-review comment. It's an edge, it's in the topology, you can literally draw where bad work goes. When somebody new joins the codebase, the failure-handling story is a picture instead of an archaeology project.
Evals on the edge: how my content line runs it
Now push the idea one level up, because gates don't have to check mechanical things like scores and empty lists. In my content pipelines, edges run evaluations: a rubric scores a generated draft, a voice check scans for the banned patterns, a stop-word detector looks for the phrases that mark machine slop, and the routing function reads those scores off the state and decides whether the work advances, retries with feedback, or stops for a human. That's QA as a structural property of the pipeline rather than a sprint ritual. The evaluation runs on unit one and on unit ten thousand with identical patience, which is a property no human review process has ever had.
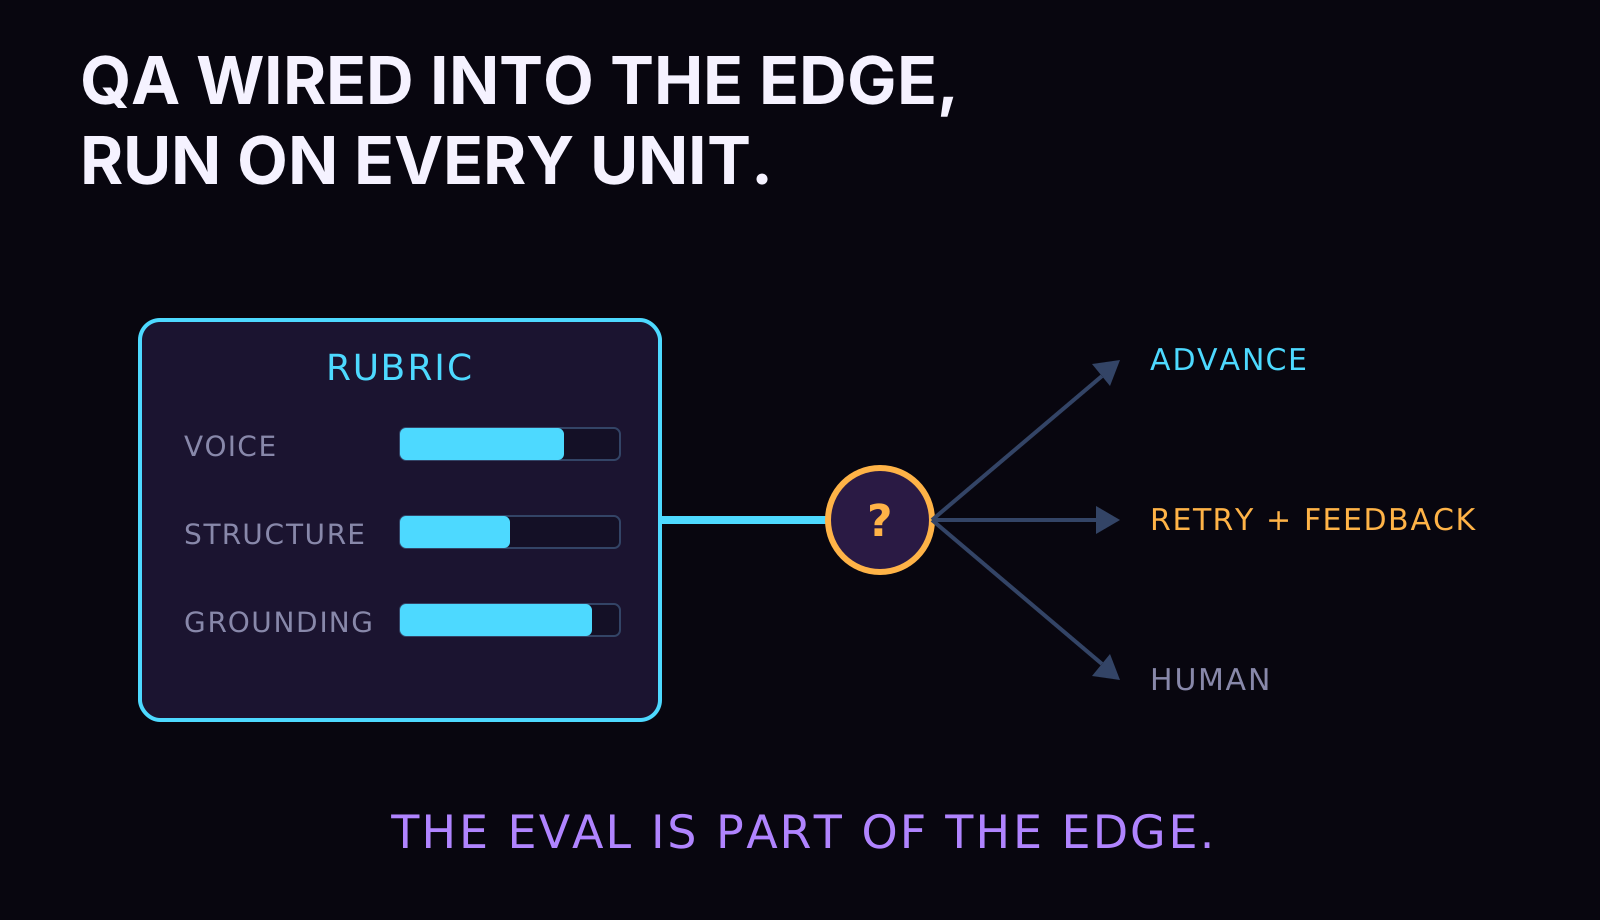
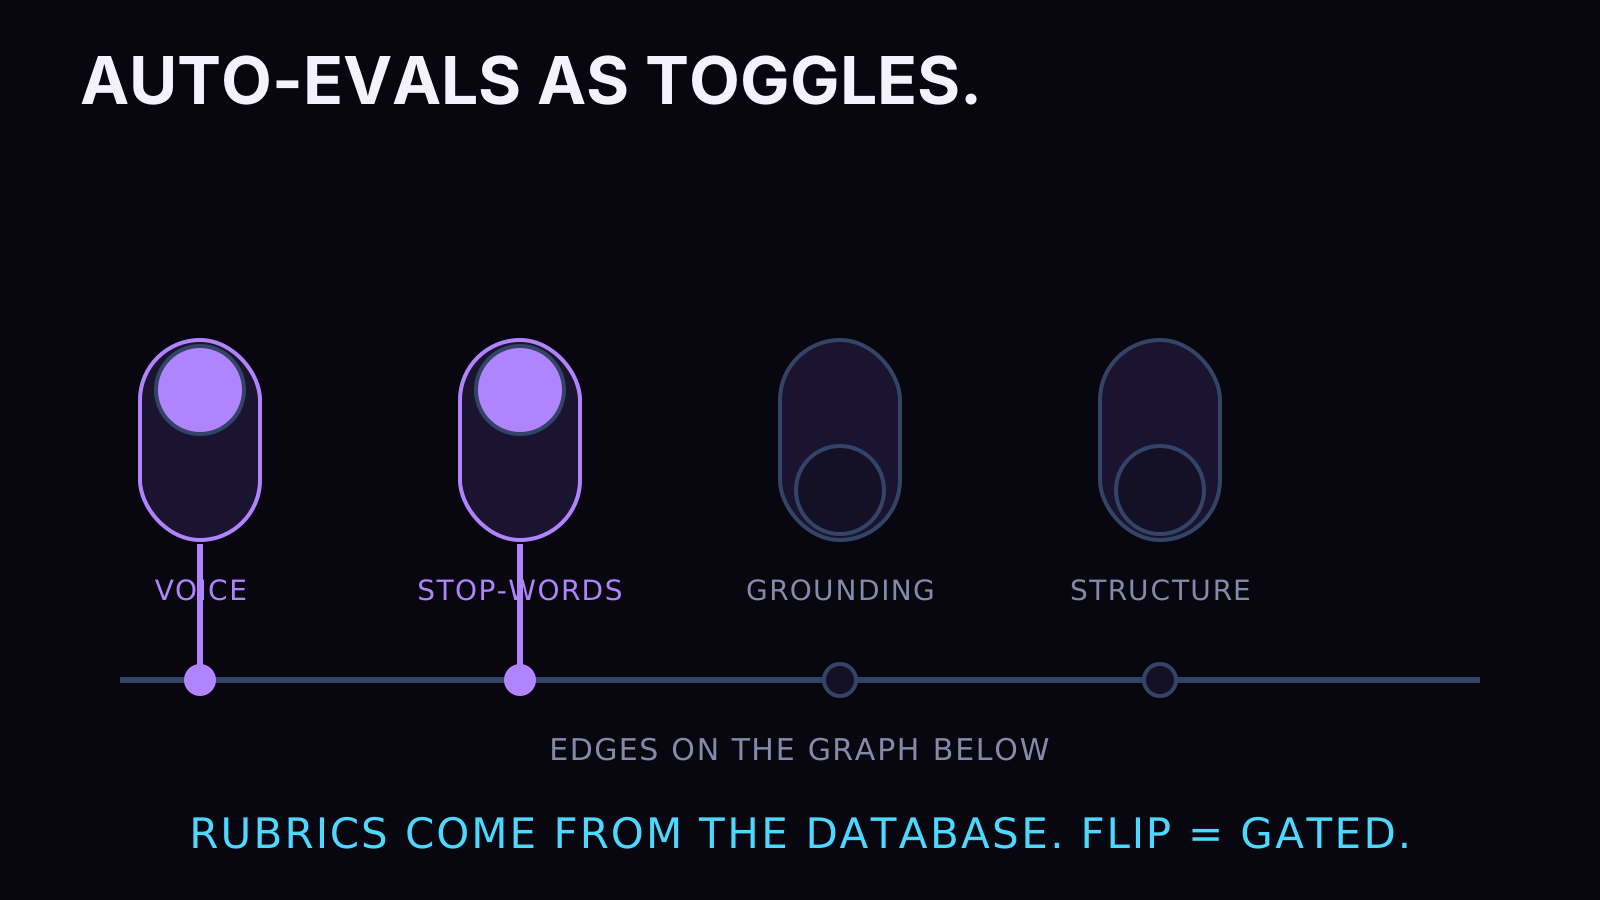
I run those checks as toggles rather than bespoke wiring. An auto-eval, in my shop's vocabulary, is a primitive you switch on at an edge: name the rubric, name the threshold source, and the gate exists. The rubric definitions live in the database per chapter two, so adding a new banned pattern to the voice check is a data edit that takes effect on the next unit through the gate. The marginal cost of one more quality check has fallen to roughly the cost of deciding you want it, and when checks get that cheap, coverage stops being a budgeting fight. You gate everything worth gating, the way you'd log everything worth logging.
What the gate writes down
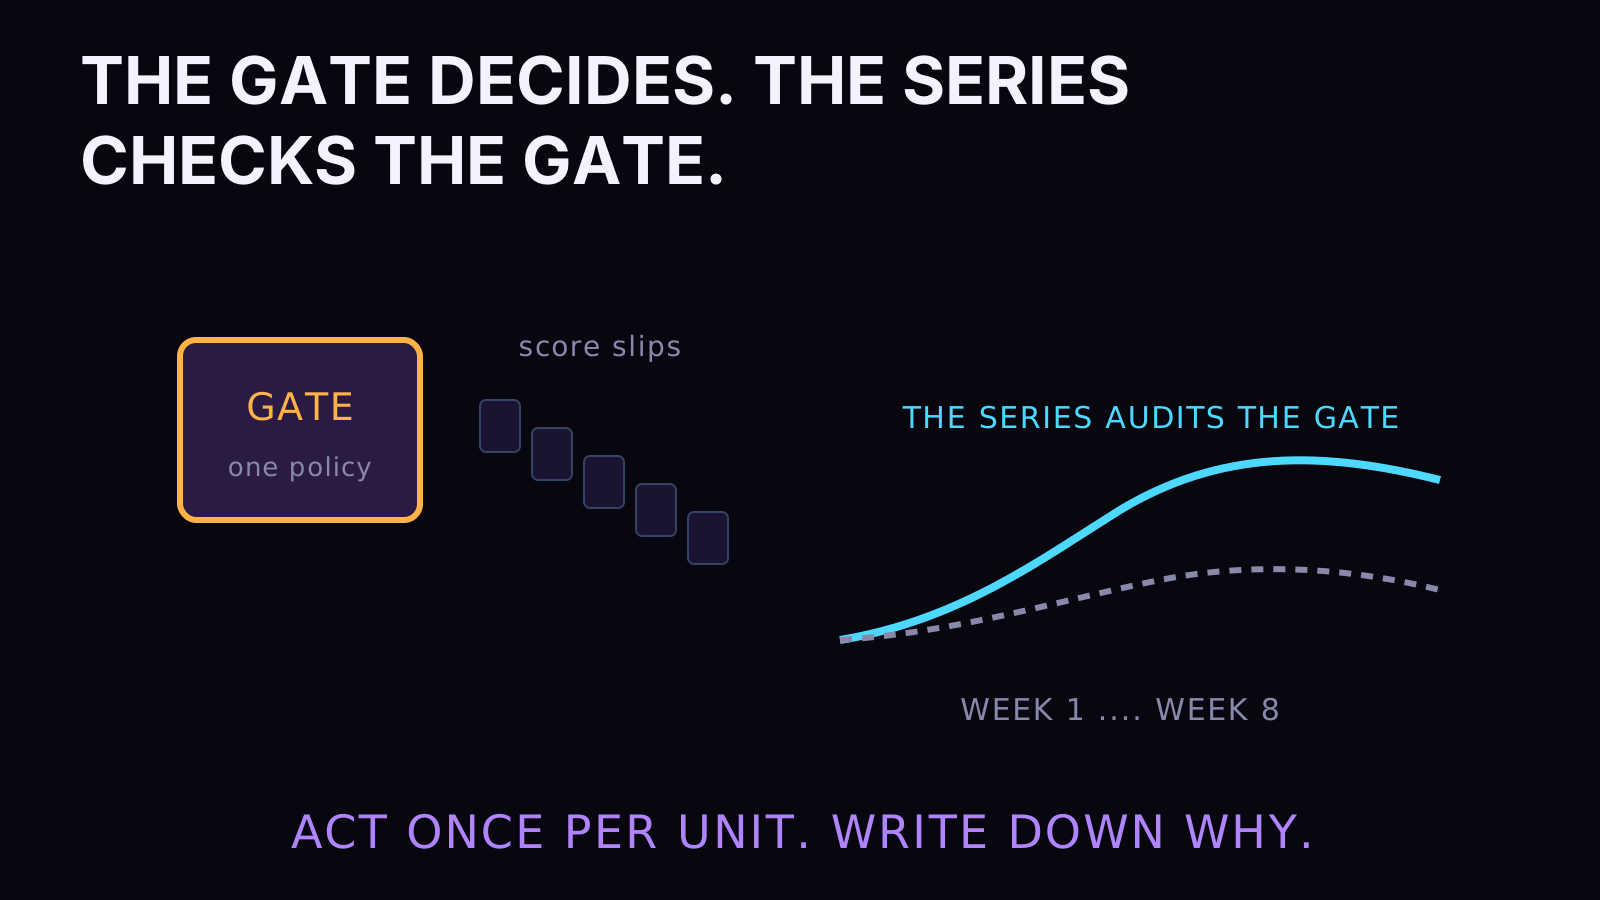
A gate's second output is the record it leaves, and the record matters as much as the routing. Every unit that hits an edge writes its scores into the state, the checkpoint keeps them, and the spans carry them, which means quality stops being an opinion and becomes a queryable series. What's the extraction score distribution this month against last month. Which source's documents fail the voice check most. Did the new parser move the repair rate. Scores are signal to watch for drift and outliers; the gate is the only place they act. I hold that line deliberately, because the failure mode on the other side is real: teams that scatter hardcoded auto-reject thresholds through their code end up with a system that silently discards good work for reasons nobody can reconstruct. One gate, declared policy, thresholds from config, everything recorded. The gate decides; the series tells you whether the gate is still right.
The dial you tighten during an incident
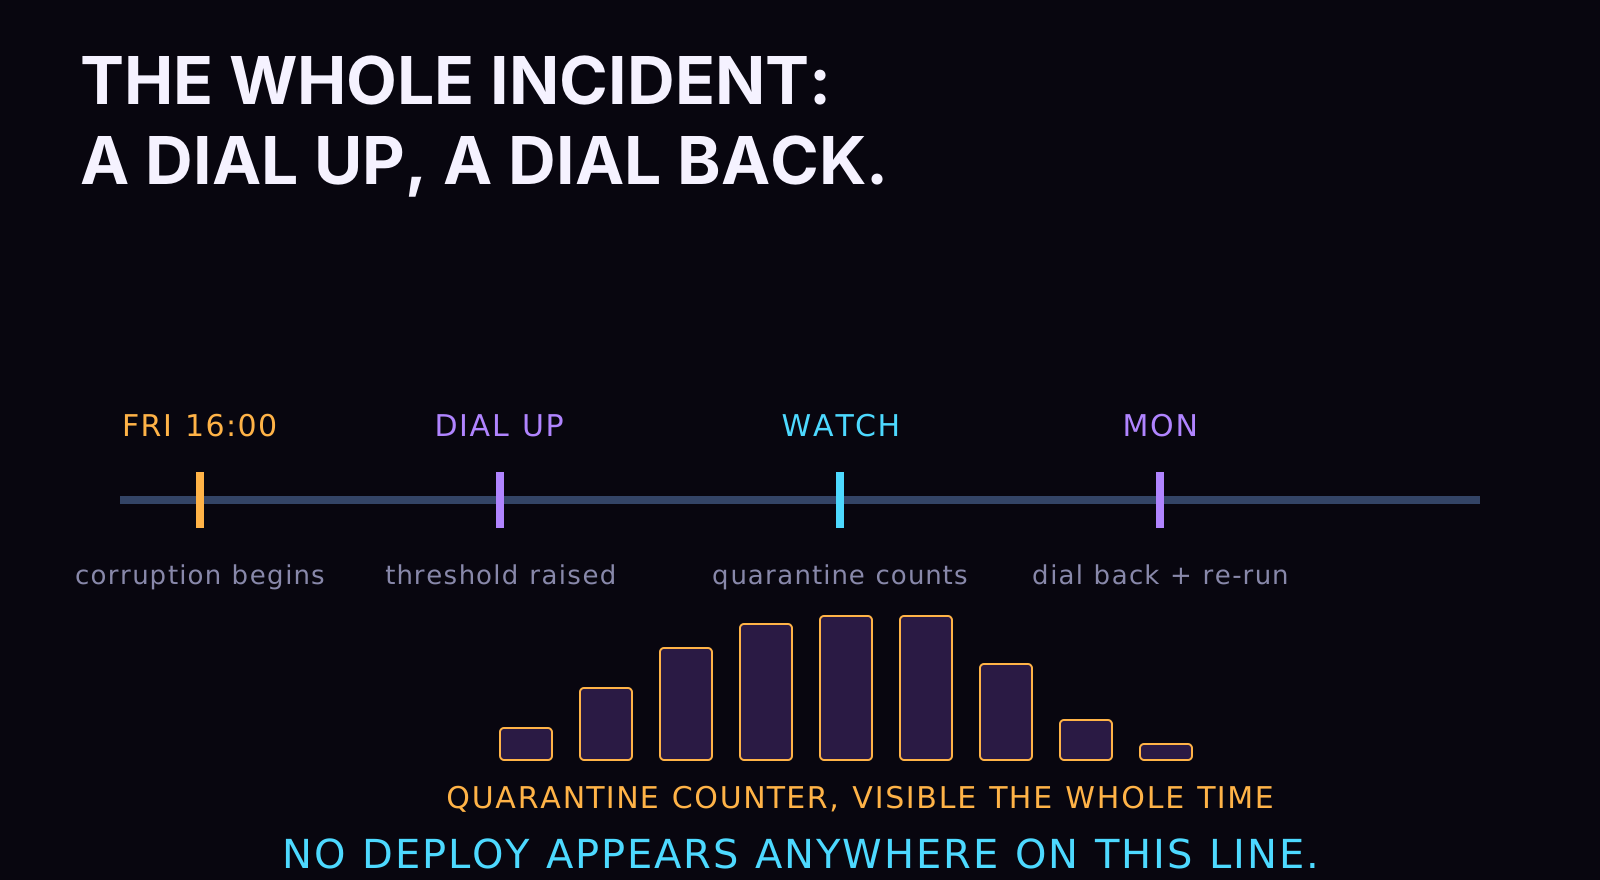
Here's where the programmable half earns its keep under pressure. Suppose a source starts shipping subtly corrupted documents at 4 p.m. on a Friday, the classic hour for it. On a dashboard-only operation, the corruption flows until a human notices the chart. On a gated graph, the response is surgical: raise the extraction threshold in the config table, and within seconds every unit crossing that edge faces the stricter bar, with the failures routing loudly into quarantine where you can count them in realtime. No redeploy, no rollback, no emergency change-review call. An incident response that consists of turning a dial and watching the quarantine counter is what operational maturity actually looks like, and it costs a threshold read plus the routing function you already wrote. When the source fixes itself Monday, the dial turns back, and the checkpointed quarantine holds everything that failed, ready to re-run through the gate.
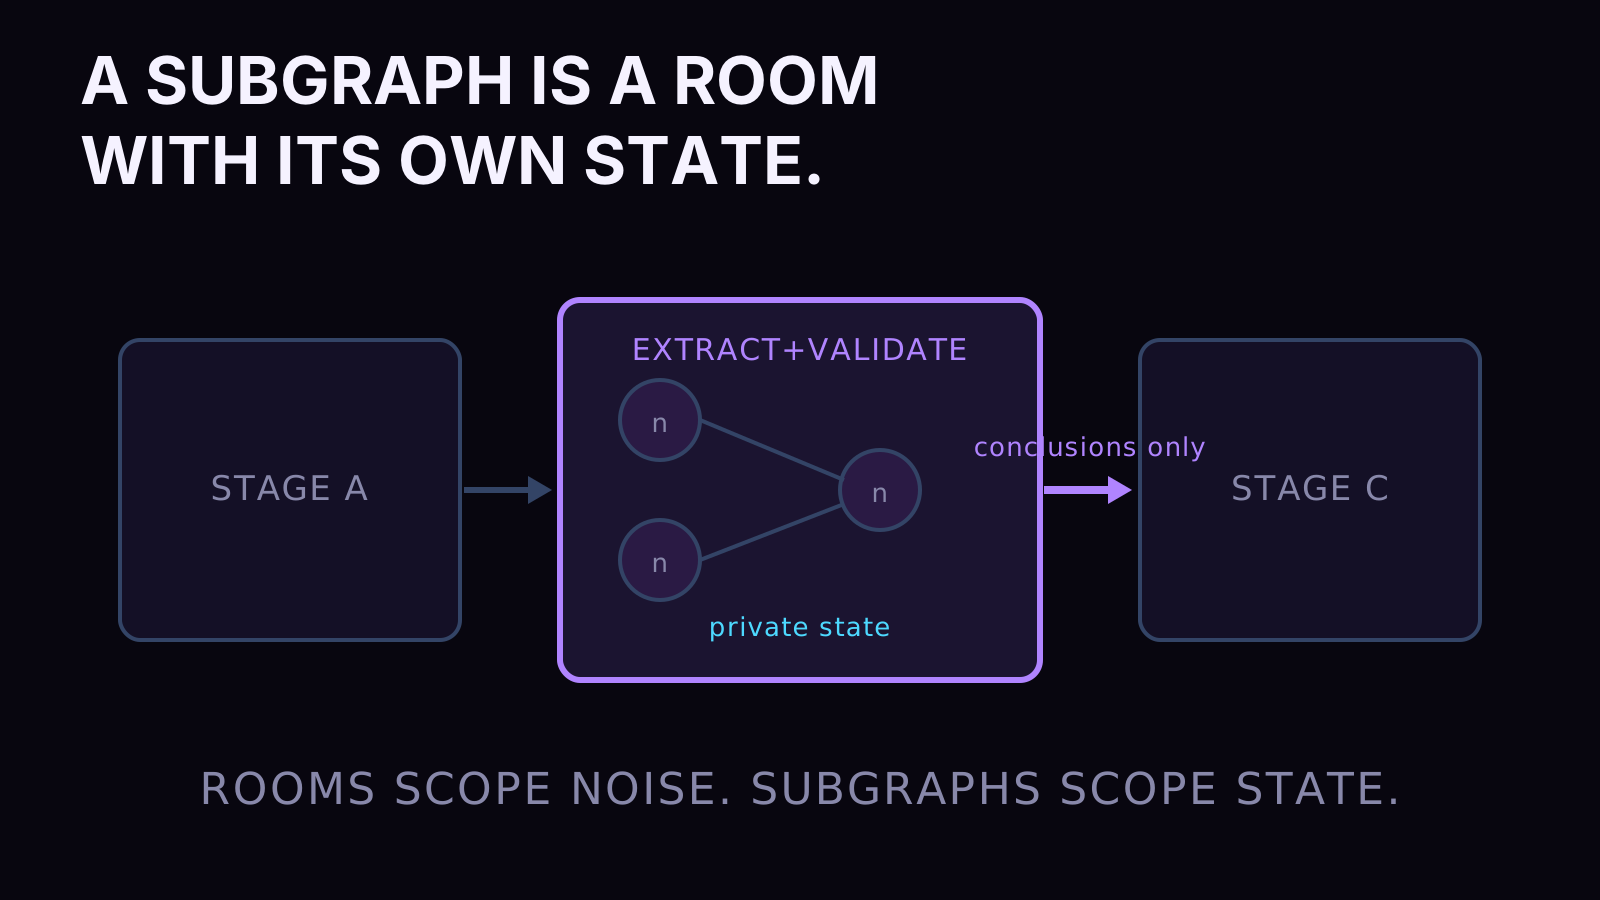
Two structural notes to finish the chapter. First, graphs nest. A subgraph is a graph used as a node, with its own state, so a gnarly stage like "extract and validate" can keep private working state and expose only its conclusions to the parent. State gets scoped like everything else worth engineering, and the parent graph stays drawable. Second, because routing functions are plain code, the guardrails are programmable in the full sense: thresholds can come from config, rubrics can come from a database, and the gate you tighten during an incident is a value change, shipped in minutes, applied to every unit that crosses the edge from then on. Try that with a quality process that lives in a wiki.
VI. Send is dynamic fan-out, and dynamic fan-out was the last excuse
Here's the structural weakness that kept heavyweight platforms in my life longer than anything else. A pipeline definition is written at author time, but the width of the work is only known at run time. You don't know how many documents landed tonight, how many chunks a document splits into, how many candidates a generation step should produce. A static DAG has to know its own shape before the data arrives, and real data declines to cooperate. Platforms solved this with dynamic task mapping features, and those features are half the reason the platforms feel heavy: expanding a graph at runtime is genuinely awkward when the graph is a deployment artifact.
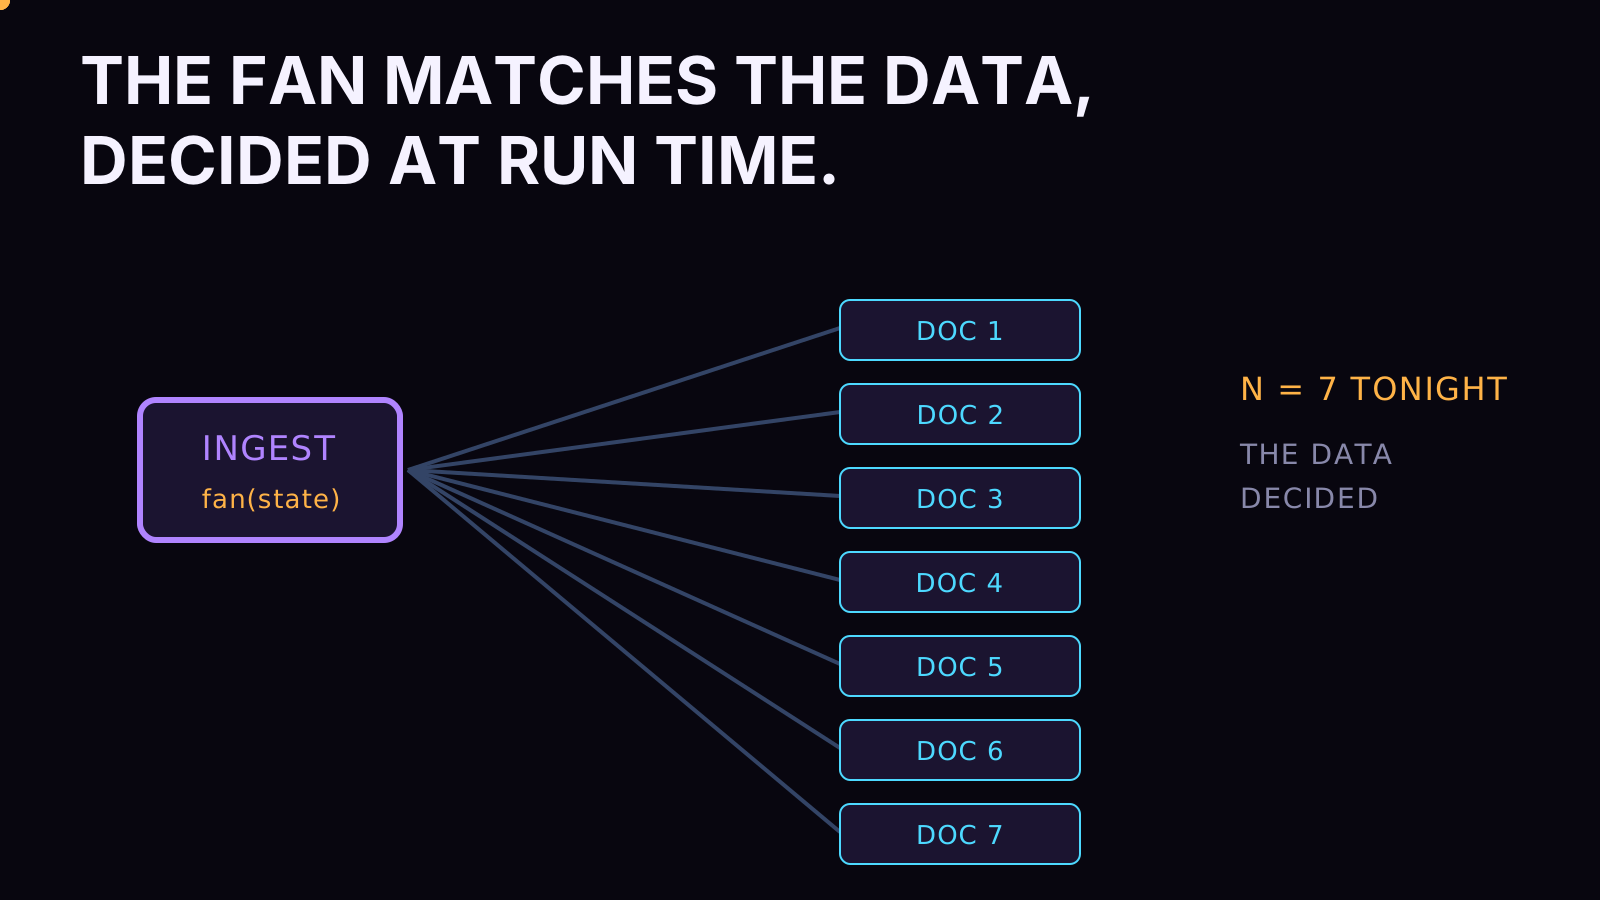
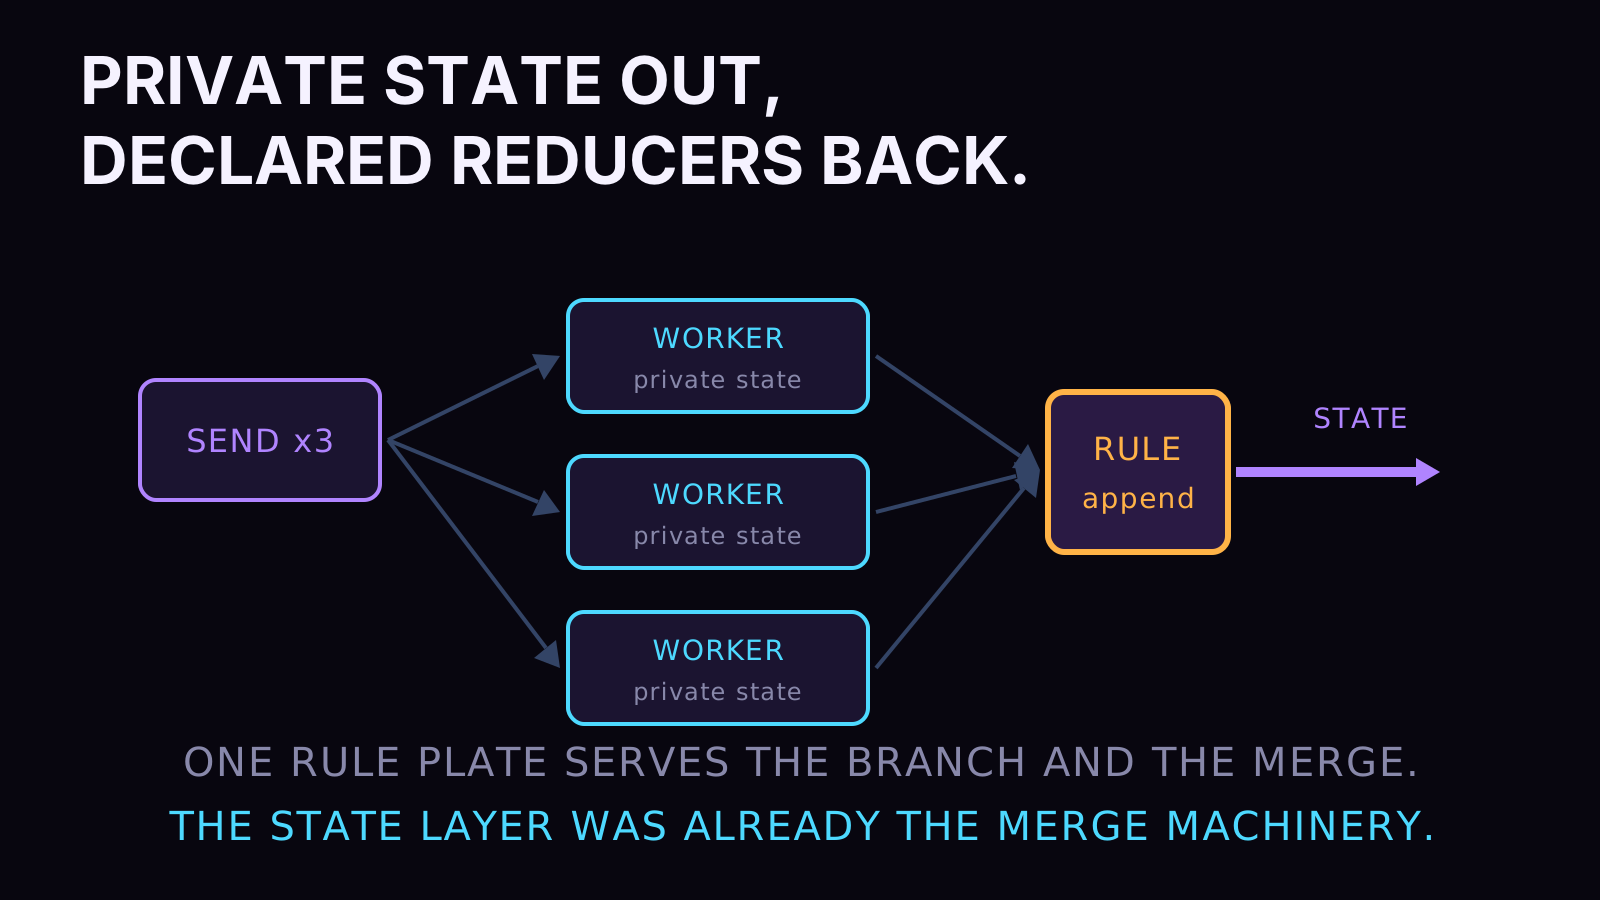
LangGraph's answer is the Send API, and it's small enough to quote whole. A routing function, the same kind that powers conditional edges, can return a list of Send objects instead of a node name. Each Send names a node and hands it its own private state. The engine runs one instance of that node per Send, in parallel, and the reducers from chapter four fold the results back into the shared state.
from langgraph.types import Send

def fan_out(state: PipelineState):
    return [
        Send("process_doc", {"doc": d})   # one worker per document,
        for d in state["docs"]            # count decided by the data
    ]

builder.add_conditional_edges("ingest", fan_out)
That's map-reduce, in the language you were already in, over the typed state you already declared. The fan-out you used to rent a cluster scheduler for now fits in a list comprehension. And the fan-in, the half everyone forgets to price, is already solved, because the chunks channel you declared with an append reducer is the merge logic. Parallel workers write, the reducer folds, order and policy are yours. No result-collection glue, no shared-memory hazards, no partial-failure mystery: a worker that dies leaves a checkpointed branch, and checkpointed branches resume.
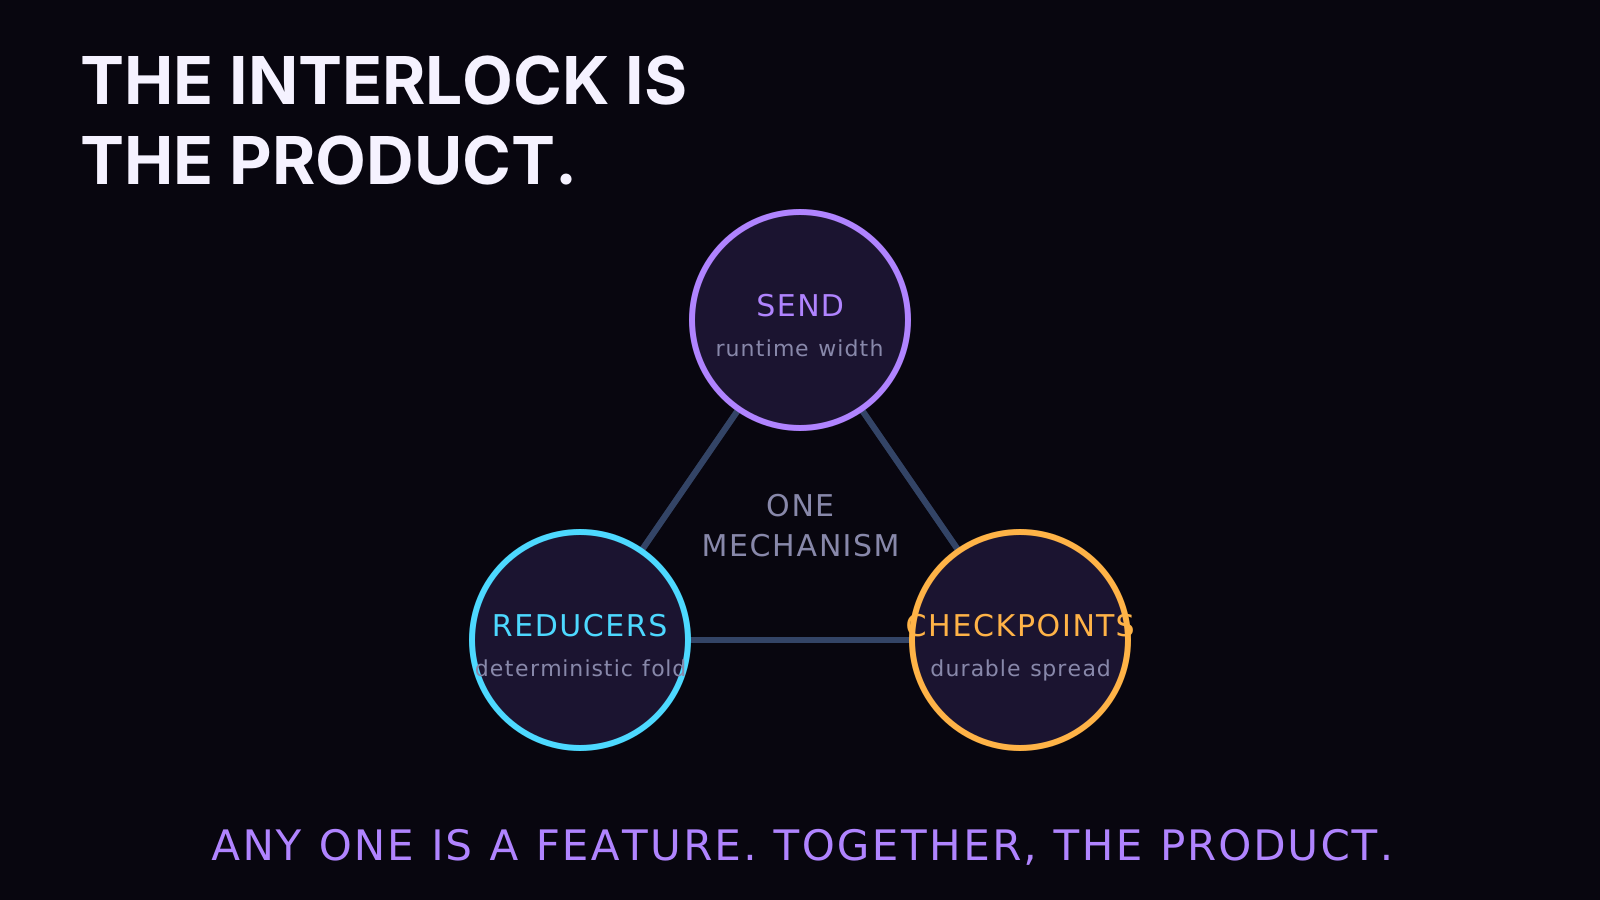
Notice how the three primitives interlock, because the interlock is the actual product. Send gives you runtime width. Reducers make the collapse back to one state deterministic. Checkpoints make the whole spread durable. Any one of them alone is a nice library feature. Together they're the exact mechanism that dynamic task mapping, result backends, and run-state stores were bundled to provide, minus the platform the bundle was welded to.
The fan-in rides the reducers, which is why it's trustworthy
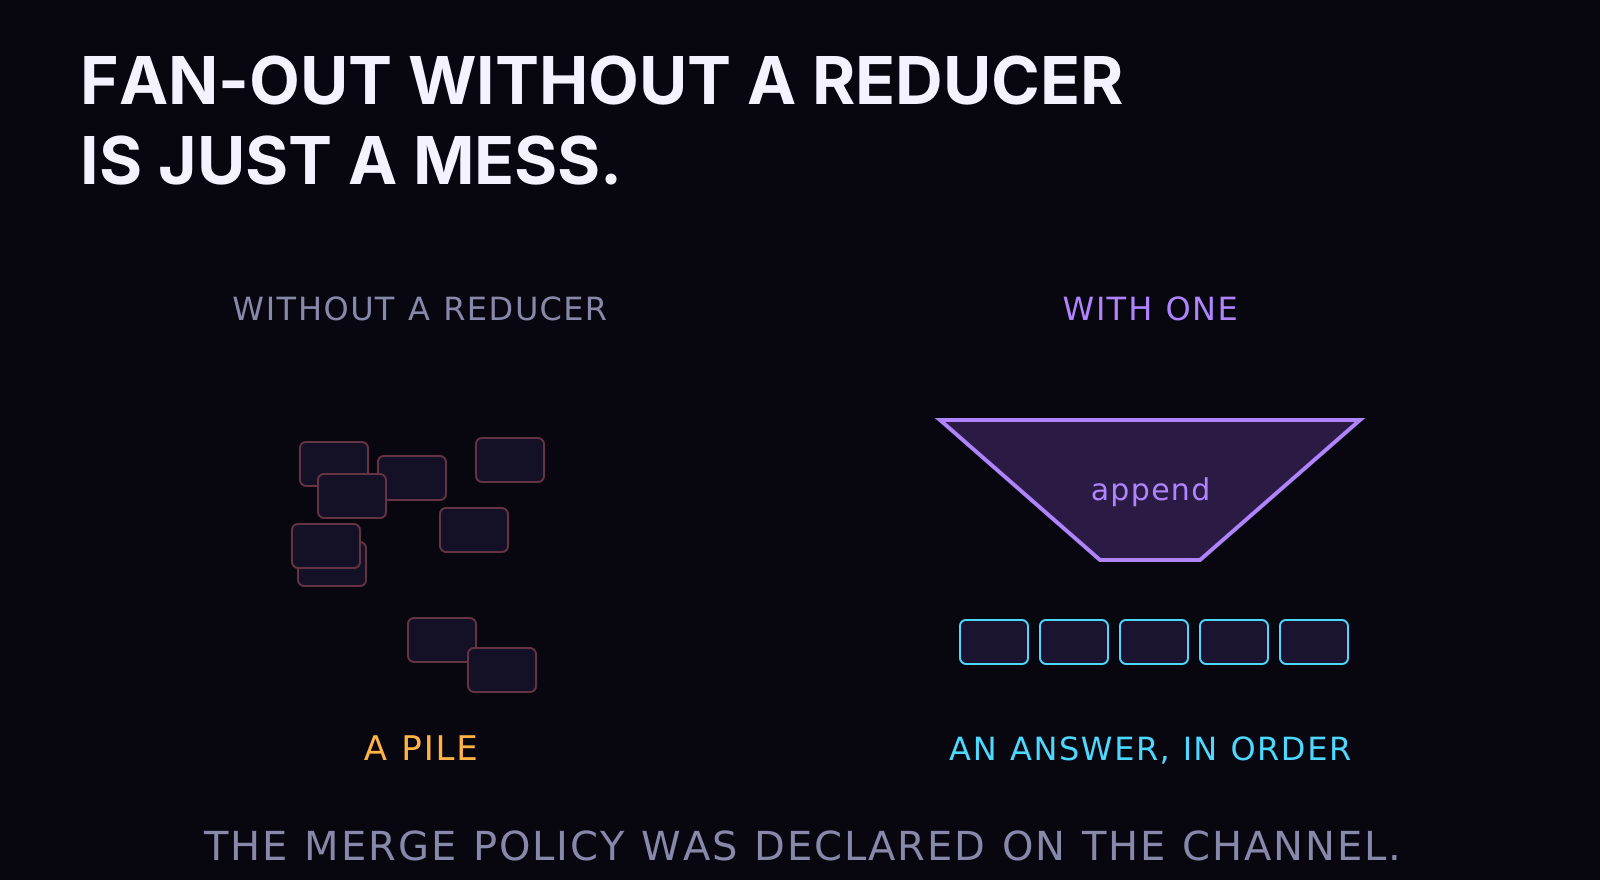
It's worth seeing why the fold back to one state is safe, because hand-rolled parallelism dies at exactly this point. Each Send hands its worker a private state, so the parallel instances can't trample each other by construction; there's no shared object to race on. When the workers finish, their updates flow back through the same channel reducers chapter four introduced. The append rule on chunks, the keep-max rule on a score, whatever policy you declared, that policy is the fan-in. Send doesn't come with its own merge machinery because it doesn't need any; the state layer was already the merge machinery. One mechanism, two jobs. That economy is the signature of a well-designed primitive, and it's the opposite smell from the platforms, where fan-out, merge, and state were three features with three configuration surfaces that had to be taught to agree.
A judge at the fan-in
The pattern I lean on hardest is fan-out with a judge at the fan-in. When a step benefits from options, generate five candidates in parallel, then route them into an evaluator that scores against a rubric and writes one winner into the state. I run this for creative work: five headline candidates fan out, an evaluator folds them to one, and the losing four cost nothing downstream because they never enter the main state. Divergence is cheap when the collapse is engineered. The same shape covers ensemble extraction, competing parsers on hostile PDFs, and any step where the first attempt has no right to be trusted.
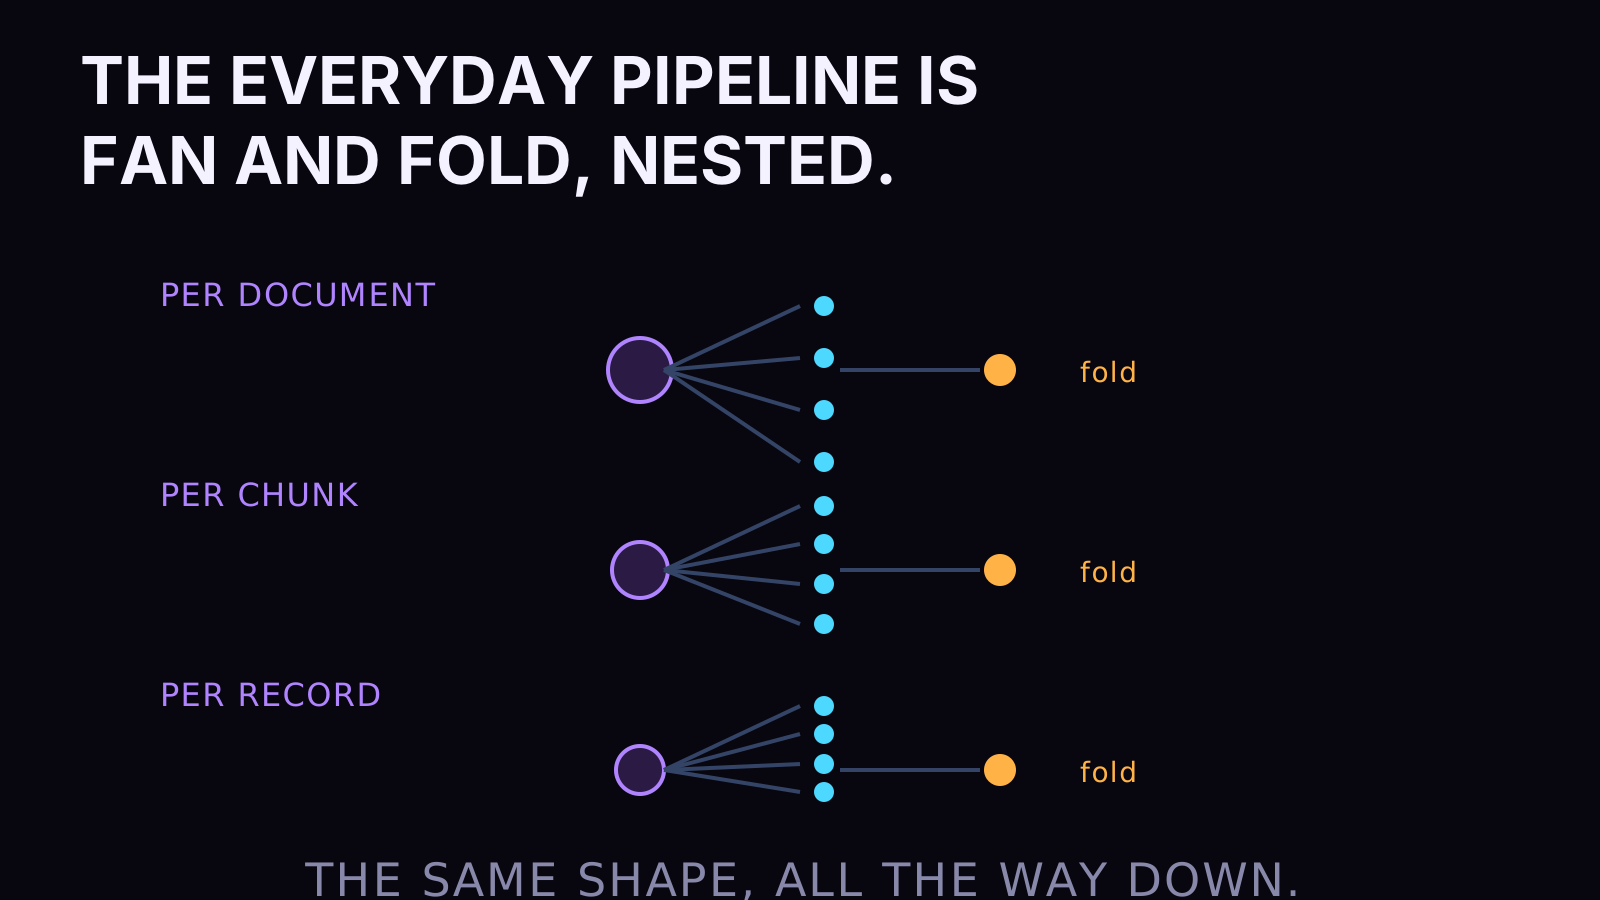
For a data engineer, the everyday case is less glamorous and more valuable: per-item processing is the shape of nearly every pipeline that matters. Per document: parse, chunk, embed. Per chunk: extract entities, score quality. Per record: enrich, validate, upsert. This site's content pipelines are exactly that shape, fanned per article and folded back into Convex, and the wiki this site serves is what the fold produces. When people ask what the orchestrator platforms were for, day to day, the answer is this loop. Which is why a language-native version of it removes so much of the reason those platforms get installed.
The article pipeline on this site, drawn whole
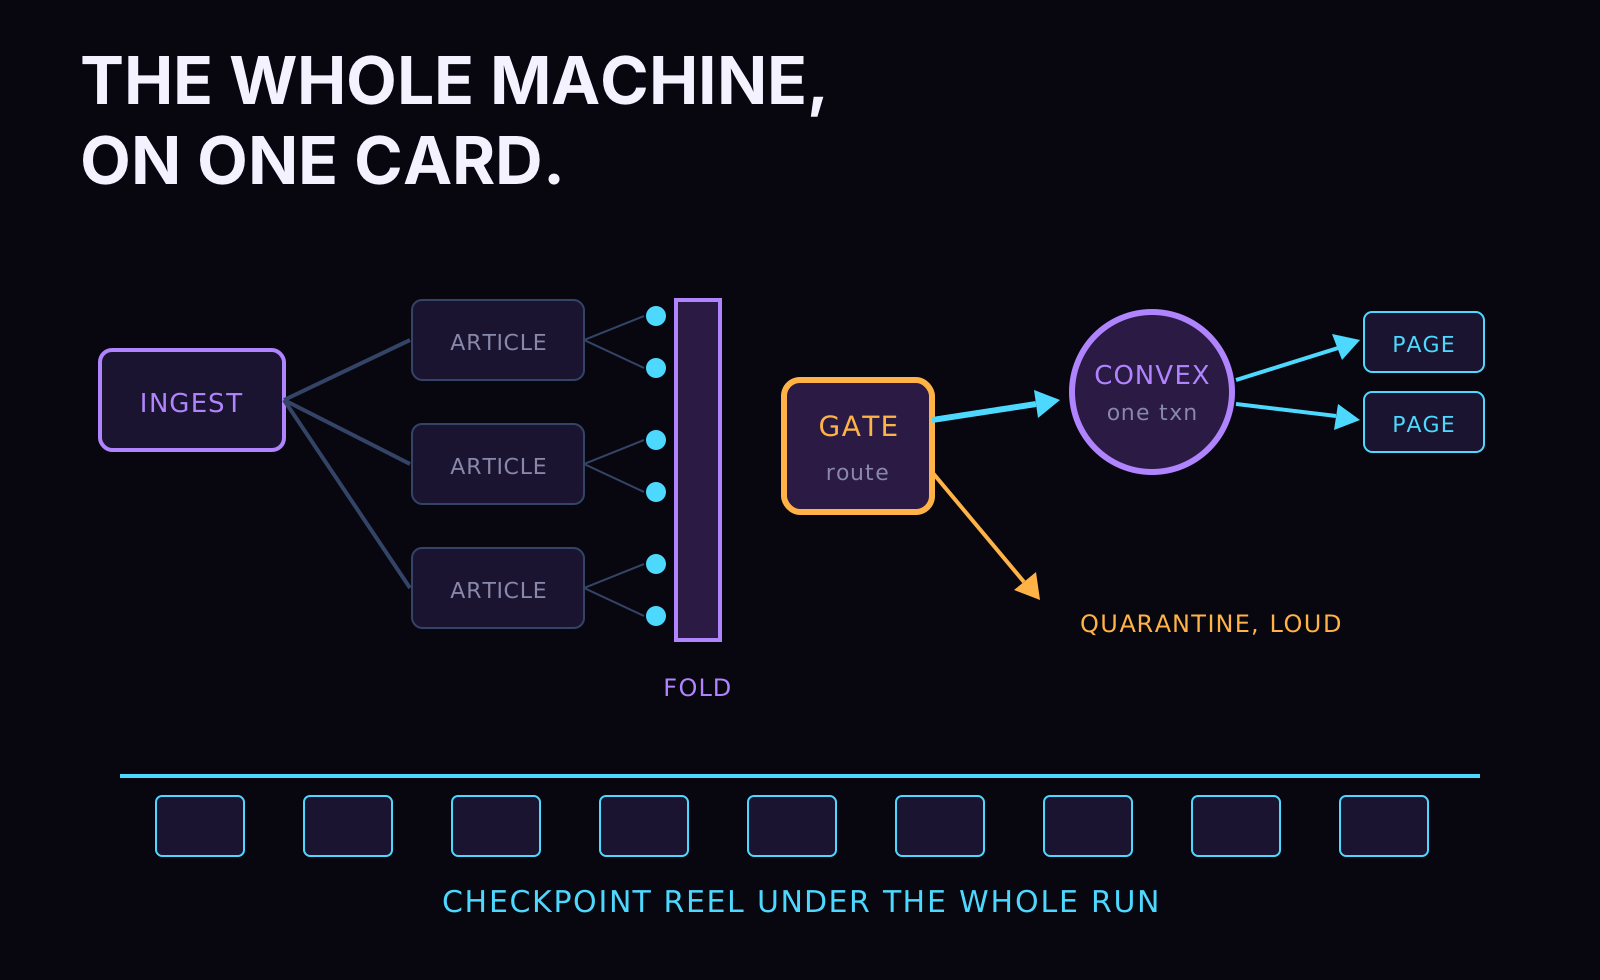
Put every primitive from the last three chapters into one running system, because assembled is how they earn. When new writing enters this site's corpus, a graph picks it up. The state is a typed model carrying the document and everything the run learns about it. The first fan-out is per article; inside each branch, a second fan spreads per chunk for extraction and scoring, and the reducers fold chunk results into the article's channels, keyed and deduplicated by the policies from this chapter's worked examples. A quality gate reads the folded scores and routes: clean work flows to the write stage, marginal work loops through repair with feedback, junk quarantines loudly. The write stage lands everything in Convex in one transaction, the reactive layer pushes it to any open page, and the checkpointer has been filing the whole biography under the run's thread the entire time. Six primitives, zero platforms, one drawable picture. When something goes wrong, I query the spans, open the checkpoint, and read what the run knew. That's the machine this note has been disassembling, shown assembled.
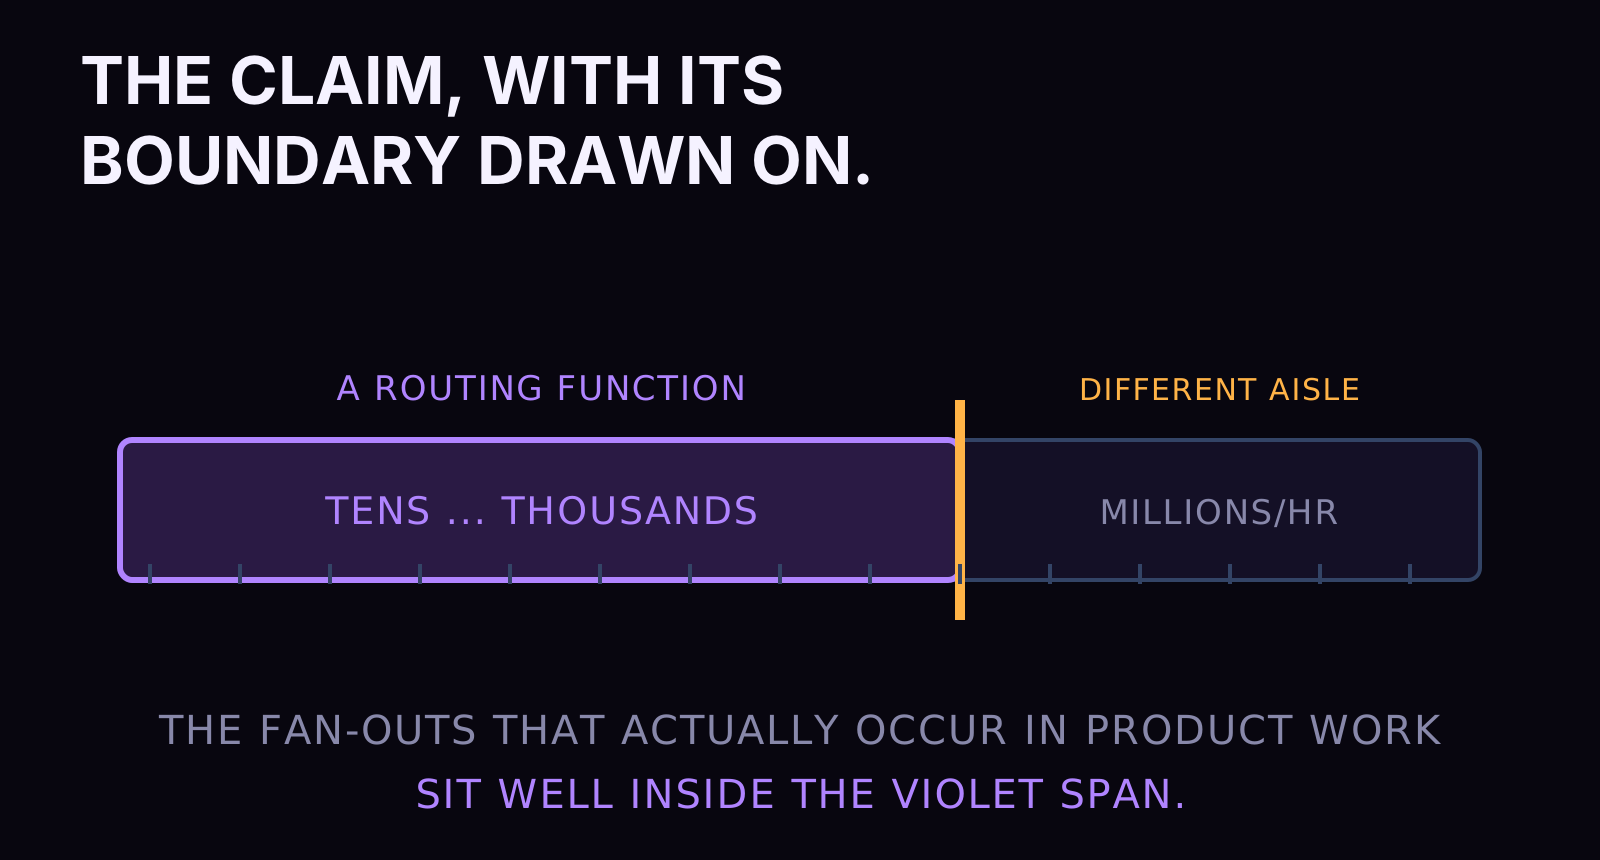
One boundary marker, per the promise in chapter one. Send parallelism lives inside a running graph on your compute. If a single item needs a GPU farm, or your fan-out is a million items an hour sustained, you're in distributed-runtime territory and you should be talking about streaming systems and worker fleets, which is a different aisle and a real one. The claim here is narrower and, for most teams, more relevant: the fan-outs that actually occur in product data work, tens to thousands of items with merge logic and failure policy, no longer justify a platform. They justify a routing function.
VII. The class that goes obsolete, and the docs nobody wrote
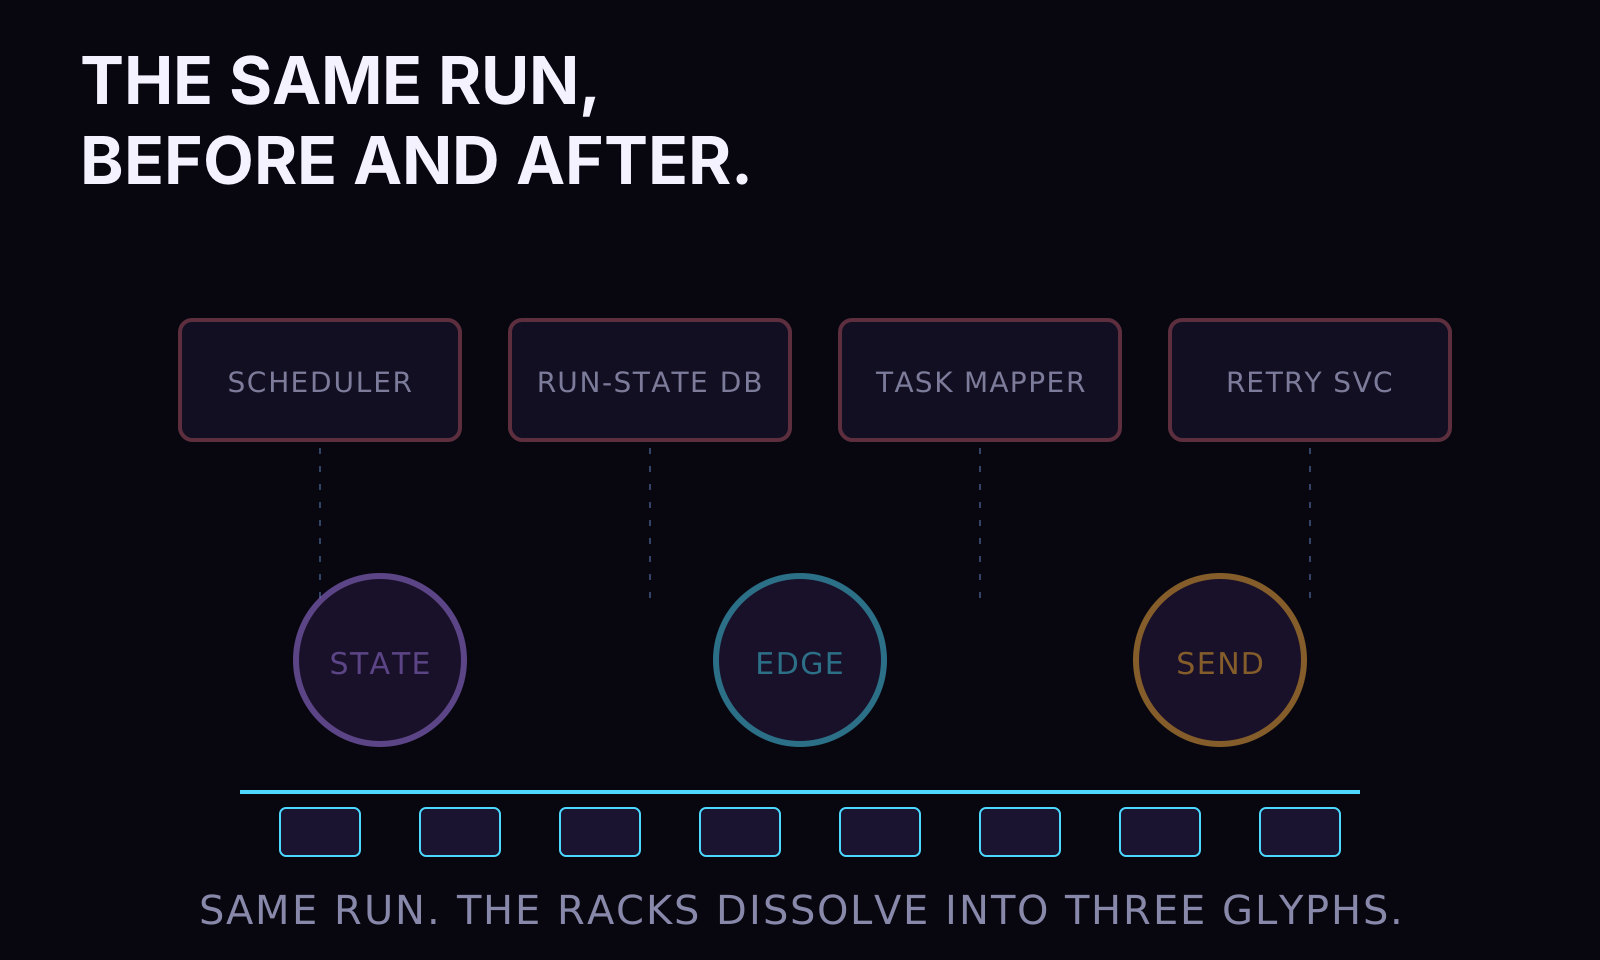
Time to say the claim at full strength and draw its border in the same breath. The tooling class that exists to move state through a DAG with retries, gates, and fan-out, for a single team's product pipelines, is obsolete. That's the mid-band of the data-infrastructure aisle: the workflow orchestrators, the pipeline platforms, the managed DAG runners, the glue services around them, deployed to shepherd the pipelines of one product built by one team. If that's what a platform is doing for you, its features have become properties of a program: typed state with reducers, conditional edges, Send, and a checkpointer, running in the language your pipeline logic was already written in.
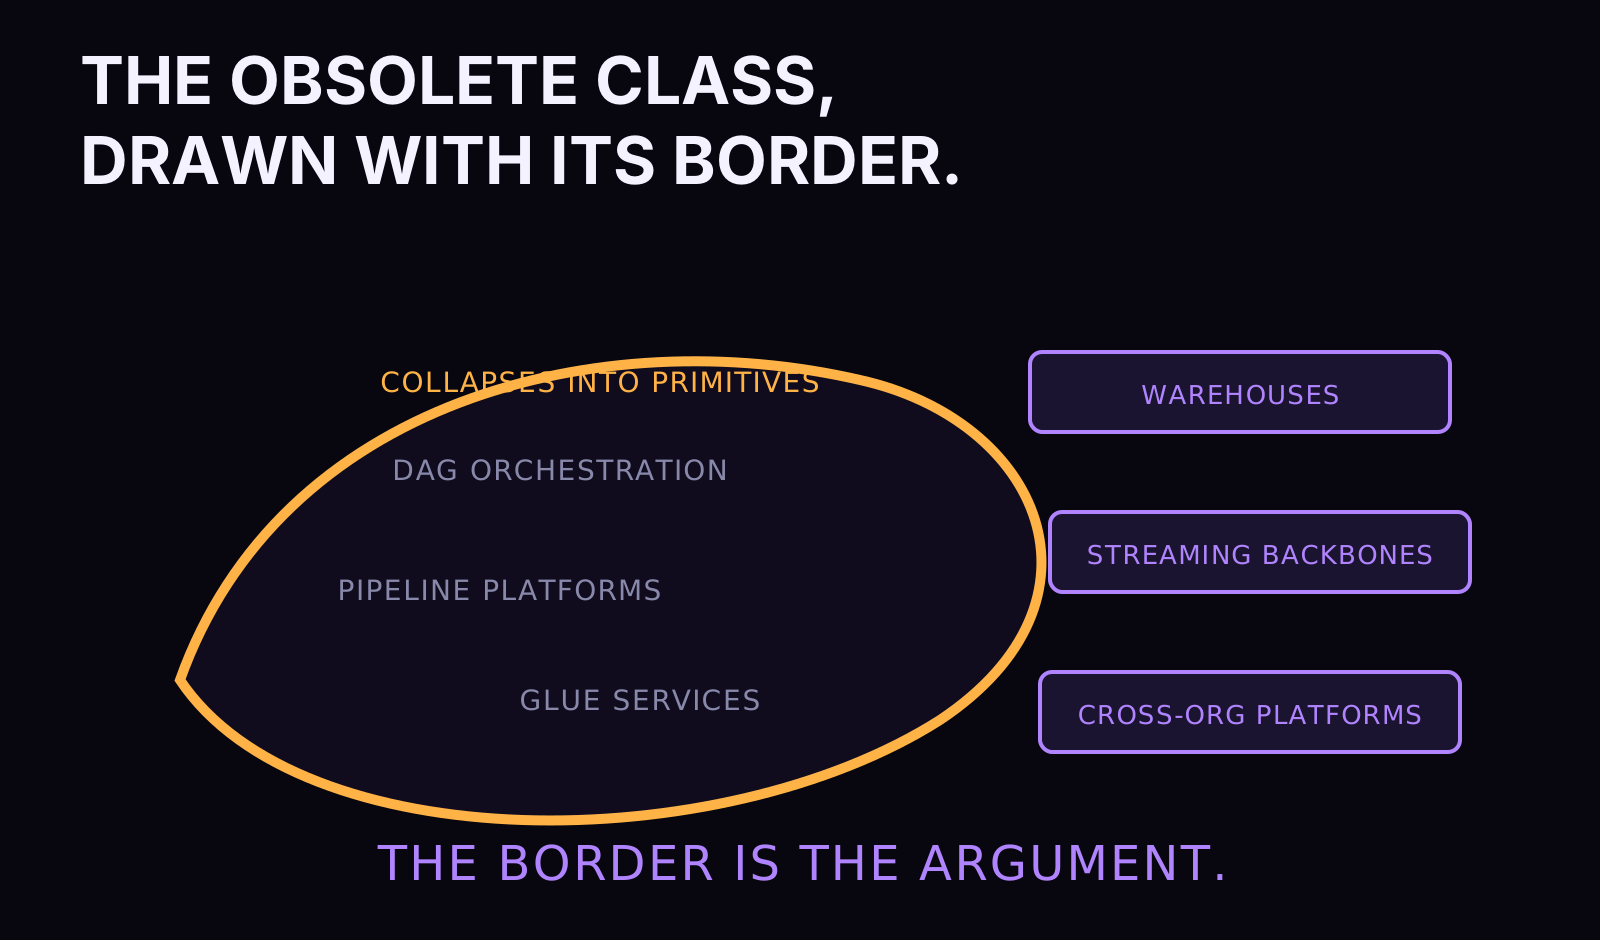
Now the border, stated as carefully as the claim. Petabyte-scale warehousing stands. Columnar engines and their optimizers are real, hard-won technology; nothing in a workflow library touches them. Streaming backbones stand. If your business is a firehose of events with subsecond consumers, the log-based systems that carry it are load-bearing and irreplaceable. Cross-organization platform orchestration stands, at least structurally: when forty teams share one scheduling substrate with quotas, lineage requirements, and a platform team whose product is the substrate itself, the coordination is the point and a library inside one repo can't do coordination between repos. The collapse I'm describing happens inside the border: one team, one product, pipelines that exist to feed that product.
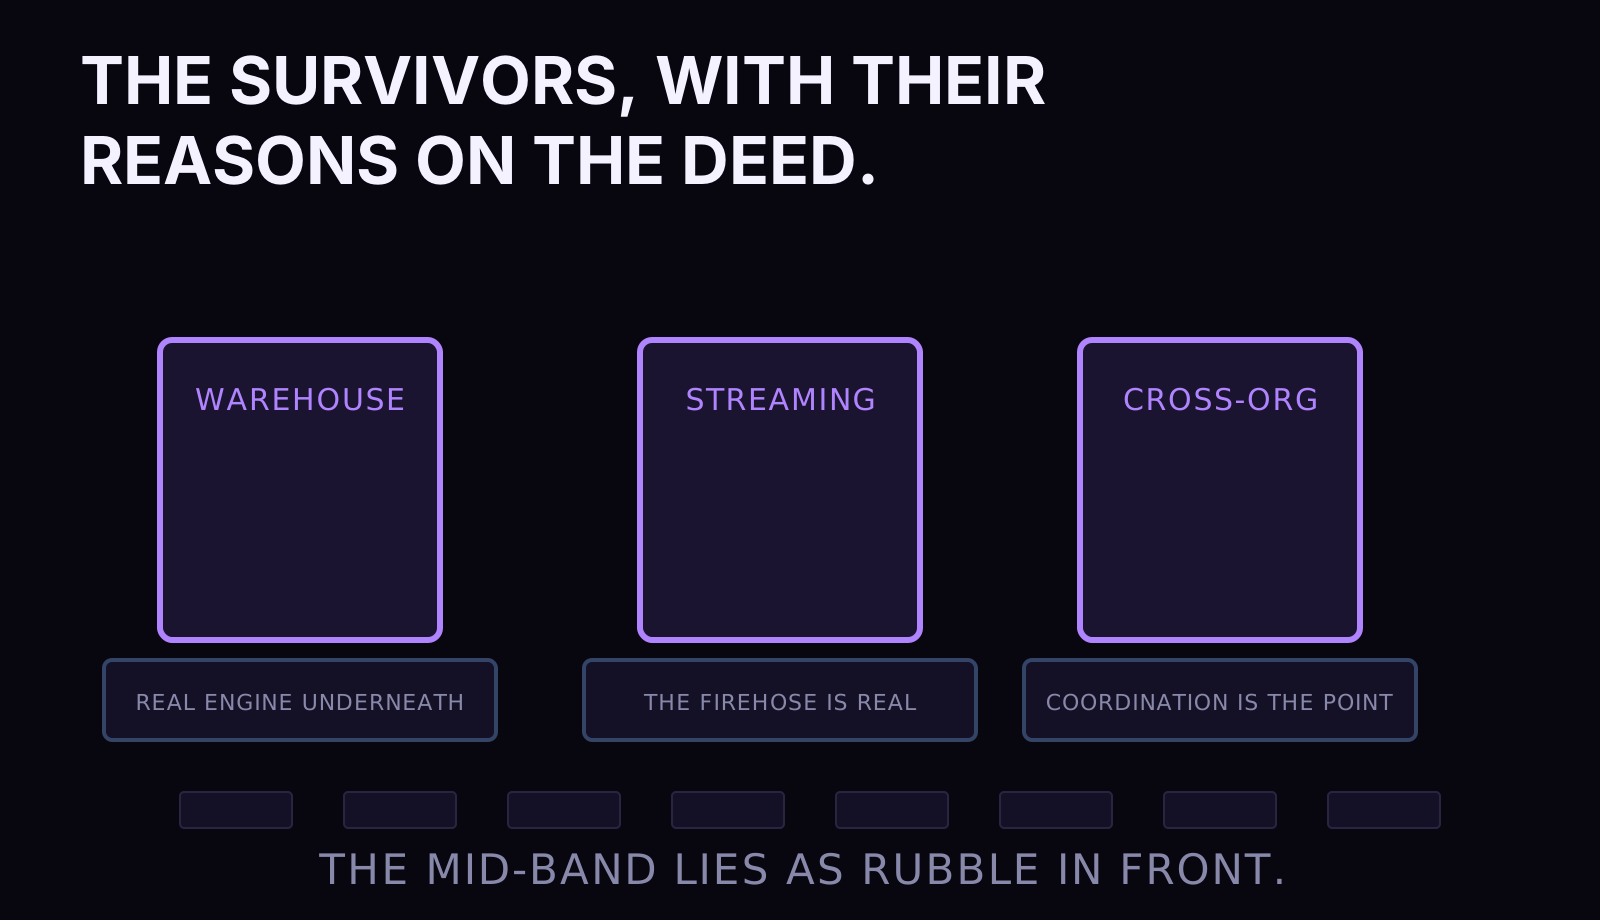
| Primitive | What it replaces | What it does not touch |
|---|---|---|
| Typed state + reducers | XCom-style state passing, result backends, merge glue | Columnar warehouses and their query engines |
| Conditional edges | Branch operators, trigger rules, quality-check DAG stages | Streaming backbones and event logs |
| Send | Dynamic task mapping, fan-out operators, worker glue | Sustained firehose-scale distributed compute |
| Checkpointer | Run-state databases, retry bookkeeping, resume machinery | Cross-org scheduling substrates with quotas and lineage |
Why do I get to call the inside of that border obsolete rather than merely contested? Because of what the platforms cost to keep once their features are program properties. An orchestrator is a server you run, patch, and upgrade. Its DSL is a dialect your pipeline logic has to be translated into and its quirks are a body of knowledge your team maintains humans for. Its runtime is a second failure domain stacked on your actual failure domain, and every incident starts with the question of which layer is lying.
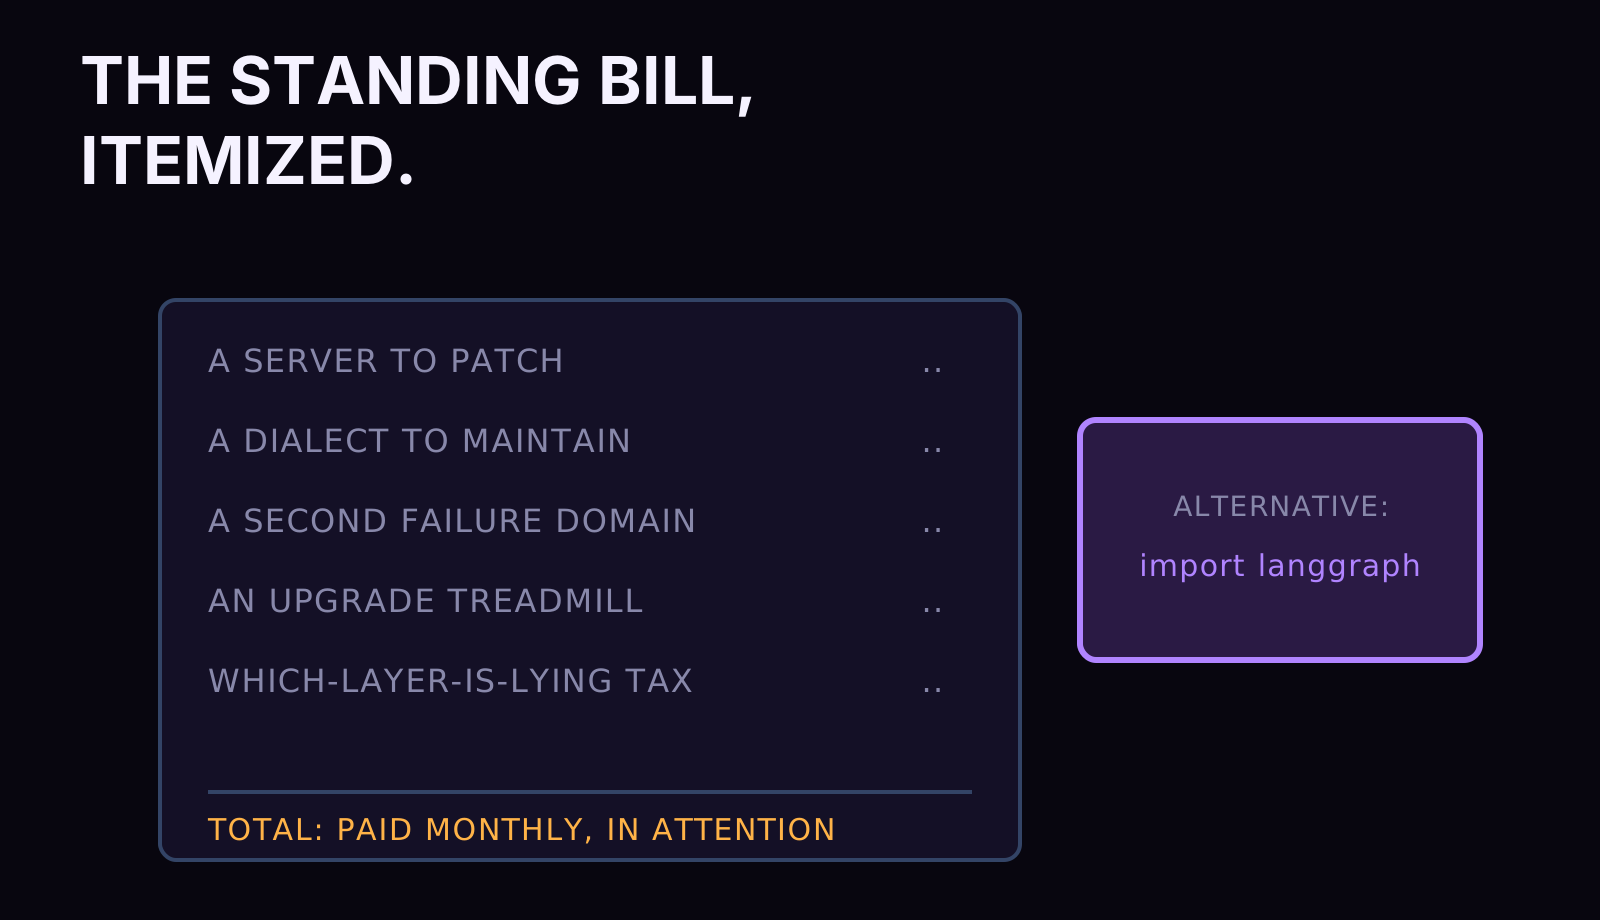
When the same properties are available as a library import, everything on that list becomes pure cost. Paying it is a choice teams will keep making for a while, because installed bases outlive their reasons. The scaffolding stays up long after the building stops needing it. But the reason is gone, and the reason was the product.

So why haven't you read this anywhere? Here's my theory, and it's a filing error, and I mean that literally. LangGraph is shelved under "AI agents." Its docs open with chat, memory means conversation history, and human-in-the-loop means approving a bot's reply. Every example orbits a model call. Data engineers don't browse the agent shelf, so a workflow engine with a state layer stronger than the orchestrators' sits unexamined by exactly the audience whose problems it dissolves. Meanwhile the people who do browse that shelf are building chatbots, and to them checkpointing looks like a chat feature rather than the death of a run-state database. Both audiences hold one half of the picture. The two halves have, as far as I can tell, barely met. This note is me introducing them.
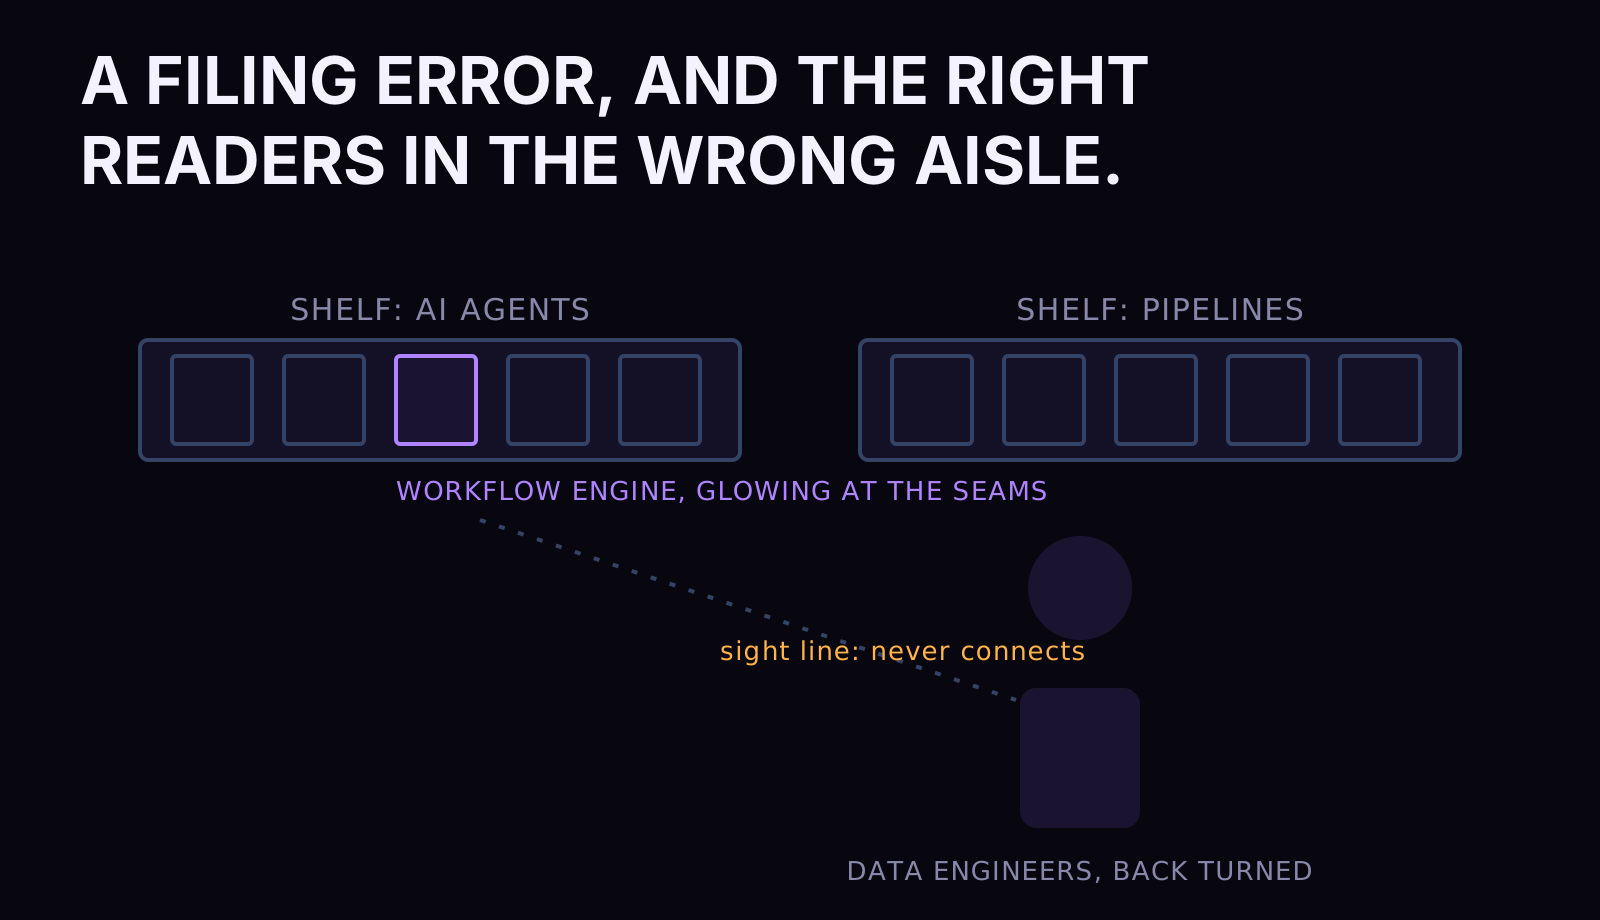
The filing error also explains the vocabulary mismatch, which is worth naming because it's what makes searching for these docs fruitless. Ask an agent-framework community about backfills, late-arriving data, or idempotent upserts and you'll get silence. Ask a data-engineering community about reducers on state channels and you'll get orchestrator answers, or a pointer at engine internals one layer down, close but aimed at a different layer entirely. The primitives exist, the audience exists, and the vocabulary that would connect them exists in neither community's search history. That's the docs gap in one sentence, and it's why I stopped waiting for someone else to write this note.

The objections, taken seriously
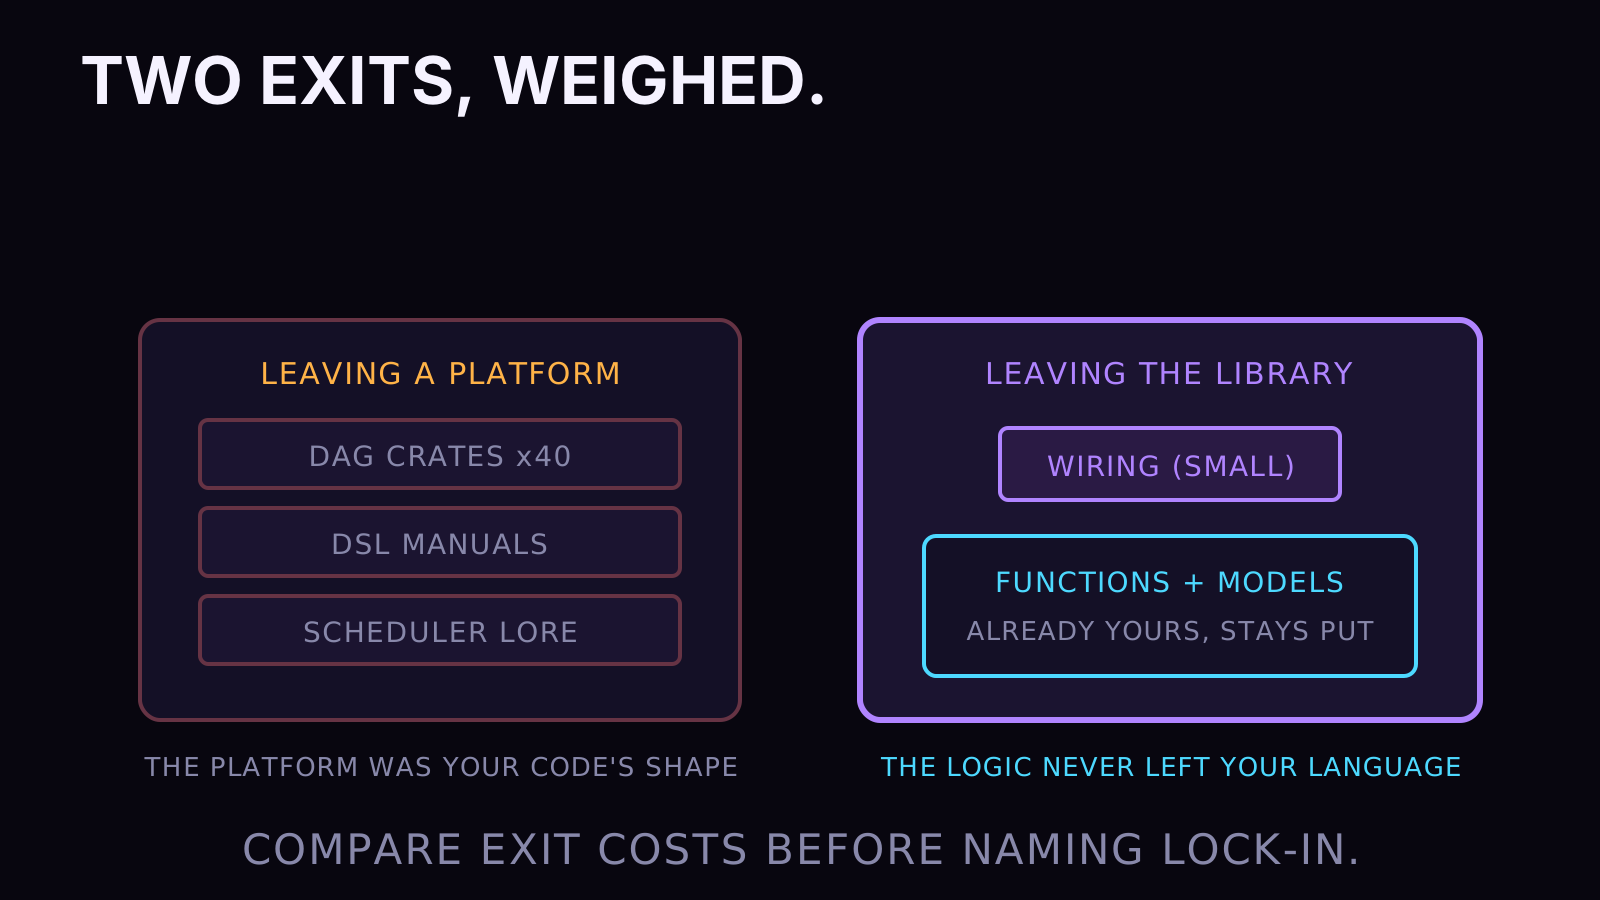
Three pushbacks come up every time I make this argument to a working data engineer, and each deserves a straight answer. "You're trading platform lock-in for library lock-in." Look at what each exit costs. Leaving an orchestrator means translating pipelines out of its DSL, its operators, and its scheduler assumptions; the platform was the shape of your code. Leaving this library means keeping your plain Python functions and your typed models, and replacing the wiring layer that connects them. The logic never left your language, so the hostage situation is smaller by construction. "Is a library this young fit for pipelines that matter?" Judge the risk surface: your transformation logic is yours either way, and the durable layer underneath the checkpointer is Postgres, which is nobody's idea of a gamble. The part that's young is the wiring vocabulary, and wiring you can read in an afternoon is a different risk class from a platform you operate for years. "My team knows the old tools." They know Python better. That was the whole point of the audit.
The docs nobody wrote, as a table of contents
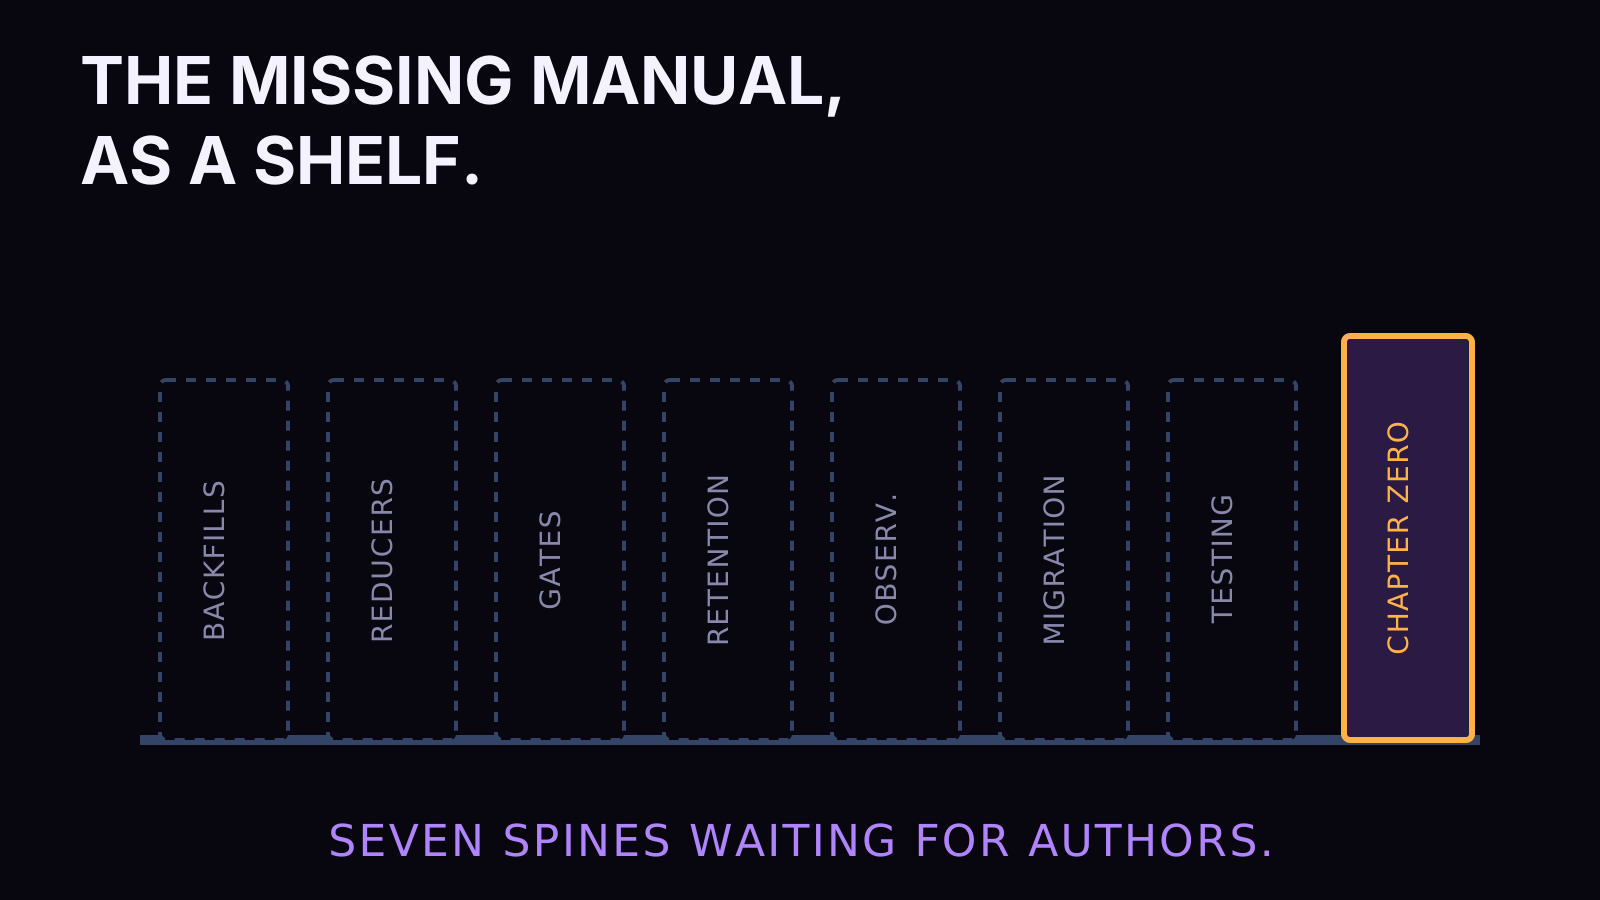
If the two communities ever do meet, here's the manual they'd write, offered as a table of contents so you can steal the outline. Each entry is a data-engineering discipline restated for graph-with-state pipelines, and every one of them is currently undocumented in exactly the way this note has been describing:
- Backfills as graph reruns. Fan-out over historical ranges, idempotent sinks, and when to fork a checkpoint instead of rerunning cold.
- Reducer design for late and duplicate data. Merge policies as the new dedupe layer: append, keyed-latest, keep-max, and when a reducer should refuse.
- Gate taxonomy. Mechanical checks, statistical checks, and eval rubrics; which belongs on which edge, and what quarantine owes the operator.
- Checkpoint retention. How long run histories live, what they cost, and what an auditor can reconstruct from them.
- Observability mapping. Spans and traces as the replacement for run-list UIs, and the queries that answer an incident.
- Migration one pipeline at a time. Running a graph next to an orchestrator without a flag day, and what to move last.
- Testing stateful graphs. Property-based state generation, gate coverage, and replaying production checkpoints as fixtures.
Any one of those chapters is a week of a practitioner's writing and a decade of collective savings. The material exists as scar tissue in a hundred teams; nobody has stapled it together because, per the filing error, the people holding the scars and the people holding the primitives shop different aisles. Consider this note chapter zero.
Positions, stated so I can be wrong in public
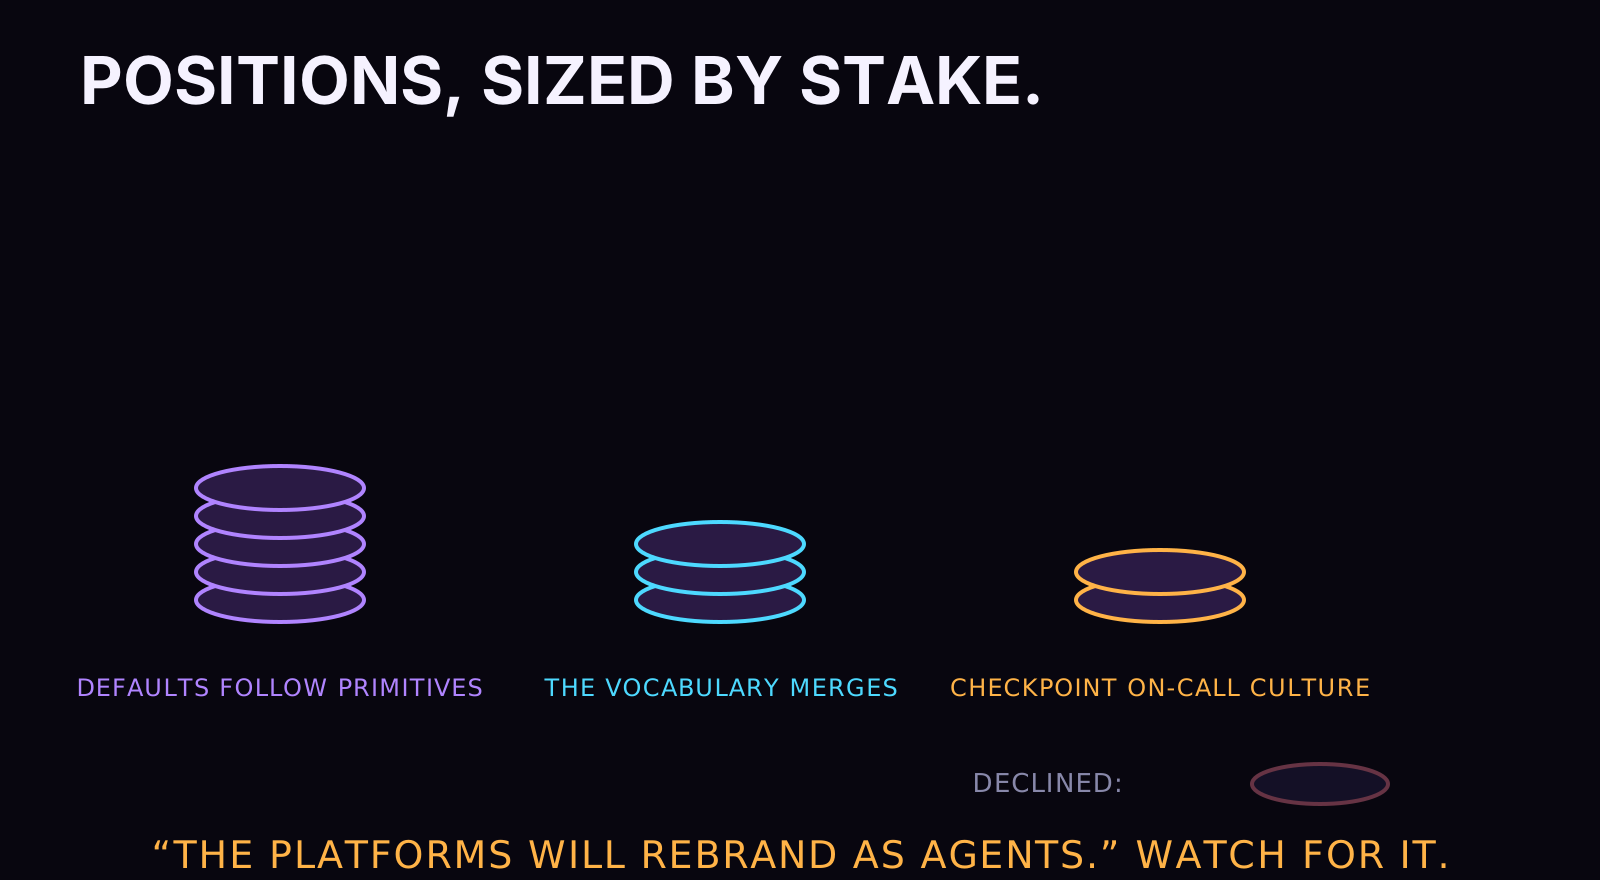
A claim that won't commit to a wager is decoration, so here are mine, sized by confidence. I'd bet heavily that new single-team pipeline projects started three years from now mostly won't install an orchestrator, the way new web projects quietly stopped installing half the middleware of the prior decade; the primitives are in the water supply now, and defaults follow primitives. I'd bet meaningfully that the vocabulary merge happens, that some name for graph-with-state data engineering takes hold and the missing manual above gets written by several hands, because gaps this economically loud rarely stay quiet once named. I'd bet modestly, expecting to be early rather than wrong, that checkpoint-native debugging changes on-call culture inside the border, because reading the run's actual state beats reconstructing it from logs by enough that whoever tastes it refuses to go back. And I decline the bet that the platforms shrink gracefully into their remaining territory. Installed bases defend themselves with rebrands, and the rebrand this time will be the word "agent" bolted onto the same control plane. Watch for it.
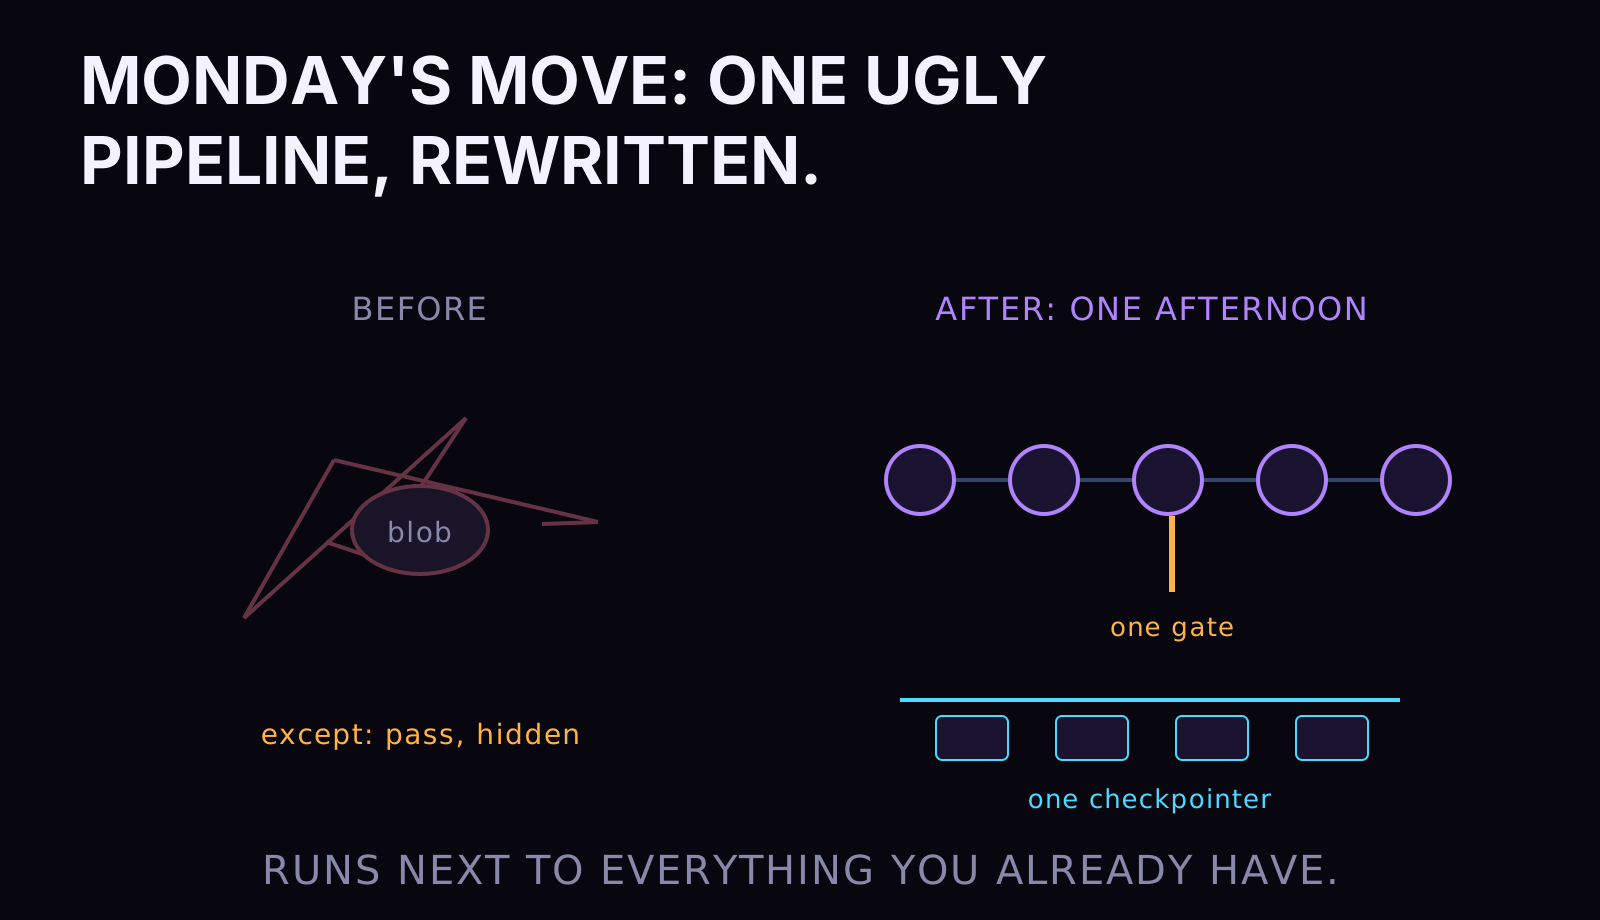
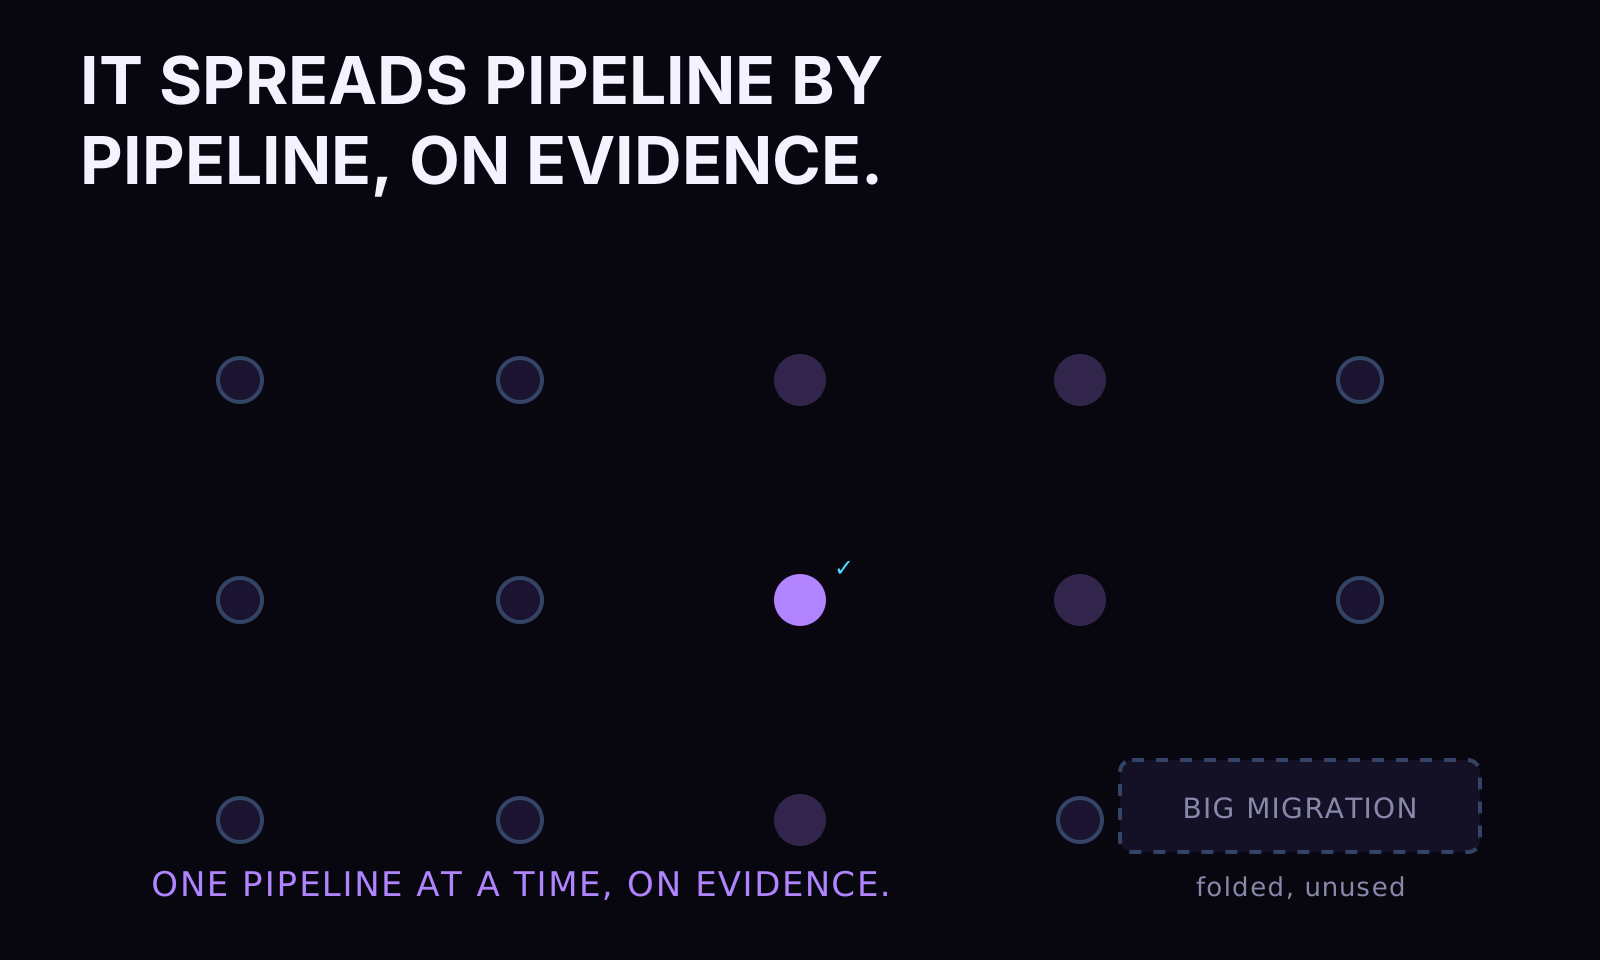
What to do with this on Monday, if you run pipelines and the claim itches. Do the smallest real thing. Pick your ugliest single pipeline, the one with the shared dict and the mystery retries, and rewrite it as a graph: typed state, one gate where a silent fallback currently lives, a checkpointer compiled in. Don't announce a migration. Don't hold an architecture review about the future of the orchestrator. One pipeline, one afternoon, running next to everything you already have. The point of the exercise arrives at the first failure, when the run resumes from its checkpoint with its state intact and you didn't have to open a platform UI to find out what it knew. Adoption of this idea spreads pipeline by pipeline, on evidence. Migration projects are how the last generation of tools got installed, and look how that inventory ended up.
VIII. Echolocation, and what the search build is really for
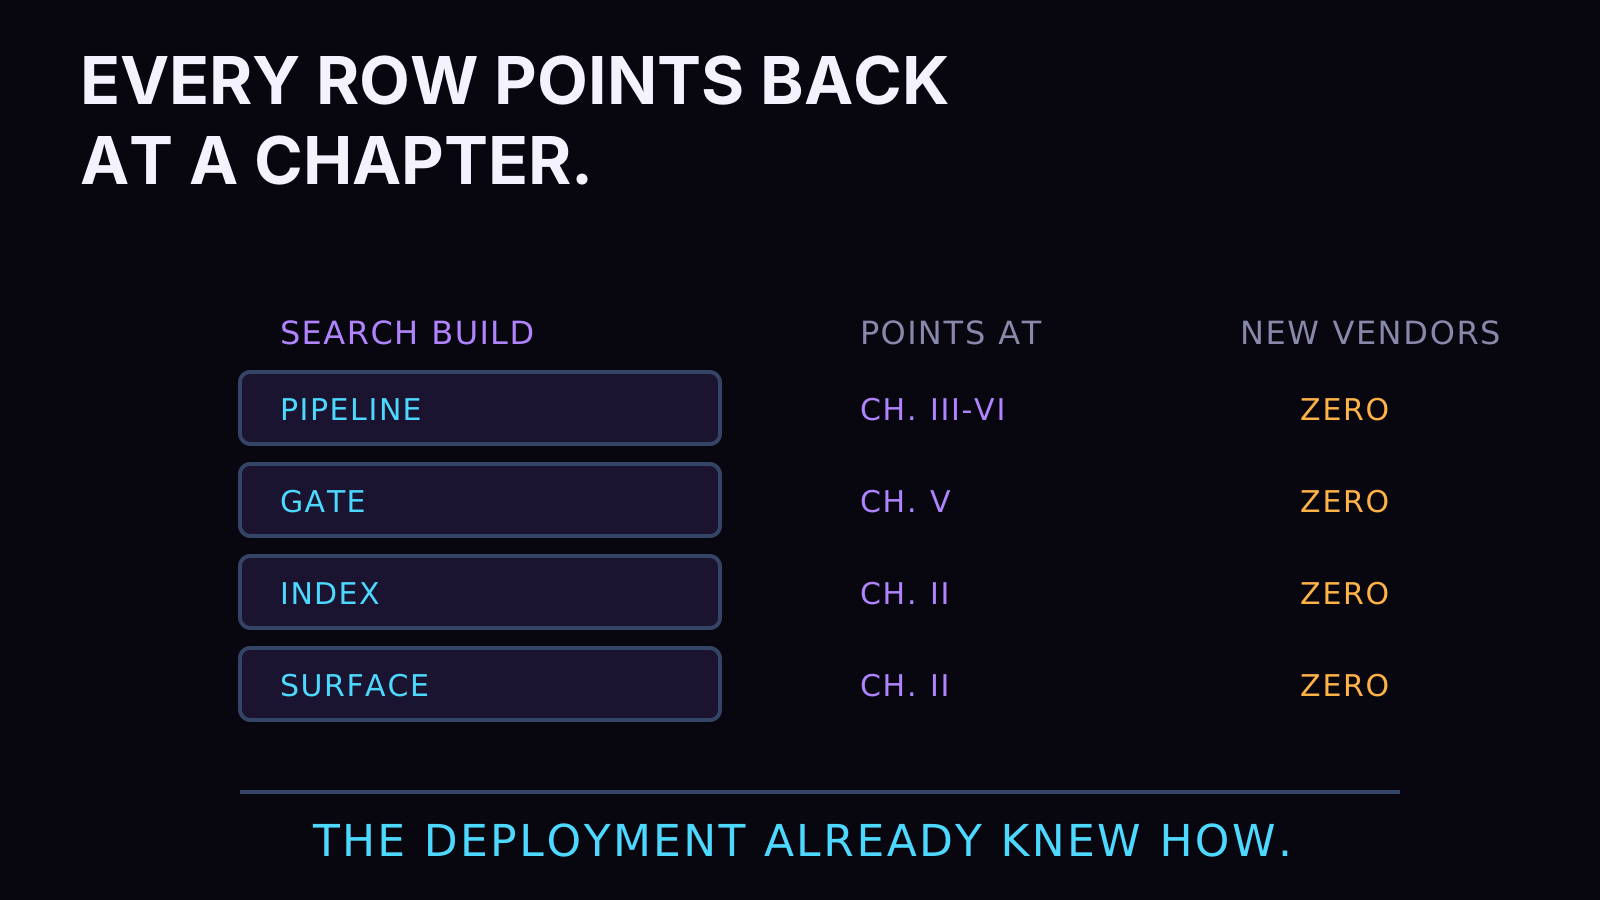
Back to the build that started this note, because the search experience I'm wiring into this site is the whole argument running in one place. The pipelines that feed it are LangGraph graphs: fan out per article, gate on quality, fold into Convex, checkpointed the whole way. The index is those six lines of schema from chapter two. The surface is a reactive query, so results move the moment the corpus does. Every chapter of this note is standing in that one feature, and when it ships you'll be able to grade the argument by using it, which is the only grading I respect for infrastructure claims.
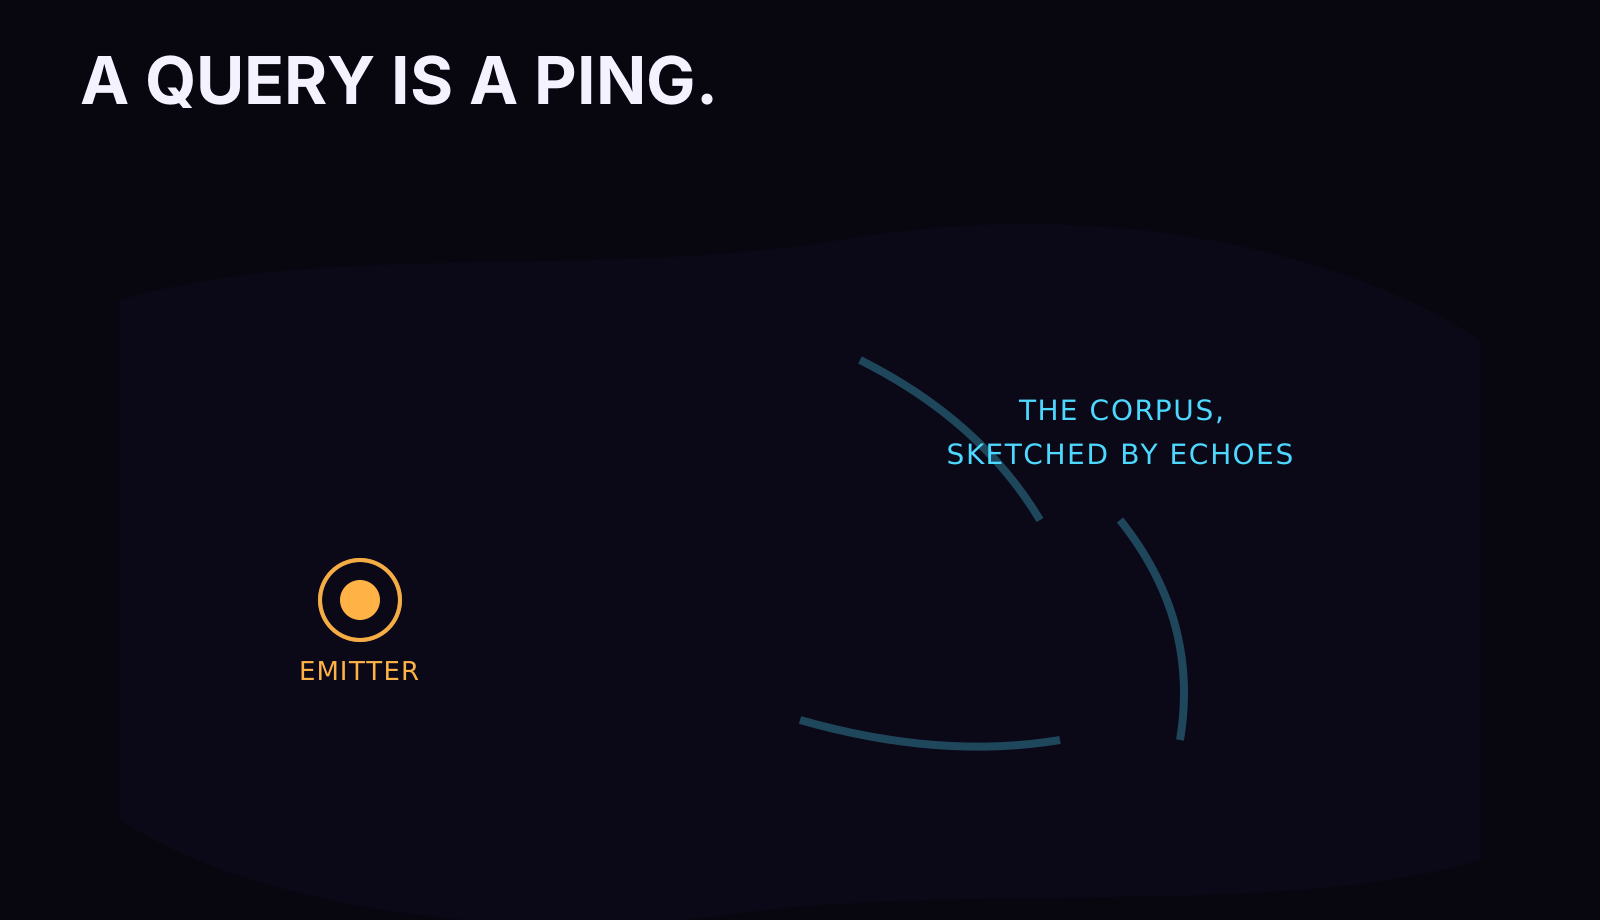
Search is also the right place to end because retrieval is echolocation. A corpus sits in the dark. You learn its shape by sending signals in and reading what comes back: which queries return riches, which return silence, where the returns cluster, where they thin out. Building a search experience over your own writing teaches you what your writing actually contains, and the lesson arrives query by query, the way a bat maps a cave. The instrument is how you see. That's true of a search box, and it's equally true of the checkpoint history and the traces this note kept pointing at: infrastructure work, done right, is mostly the discipline of making dark systems answer.

The layers the search stands on, and where it goes next
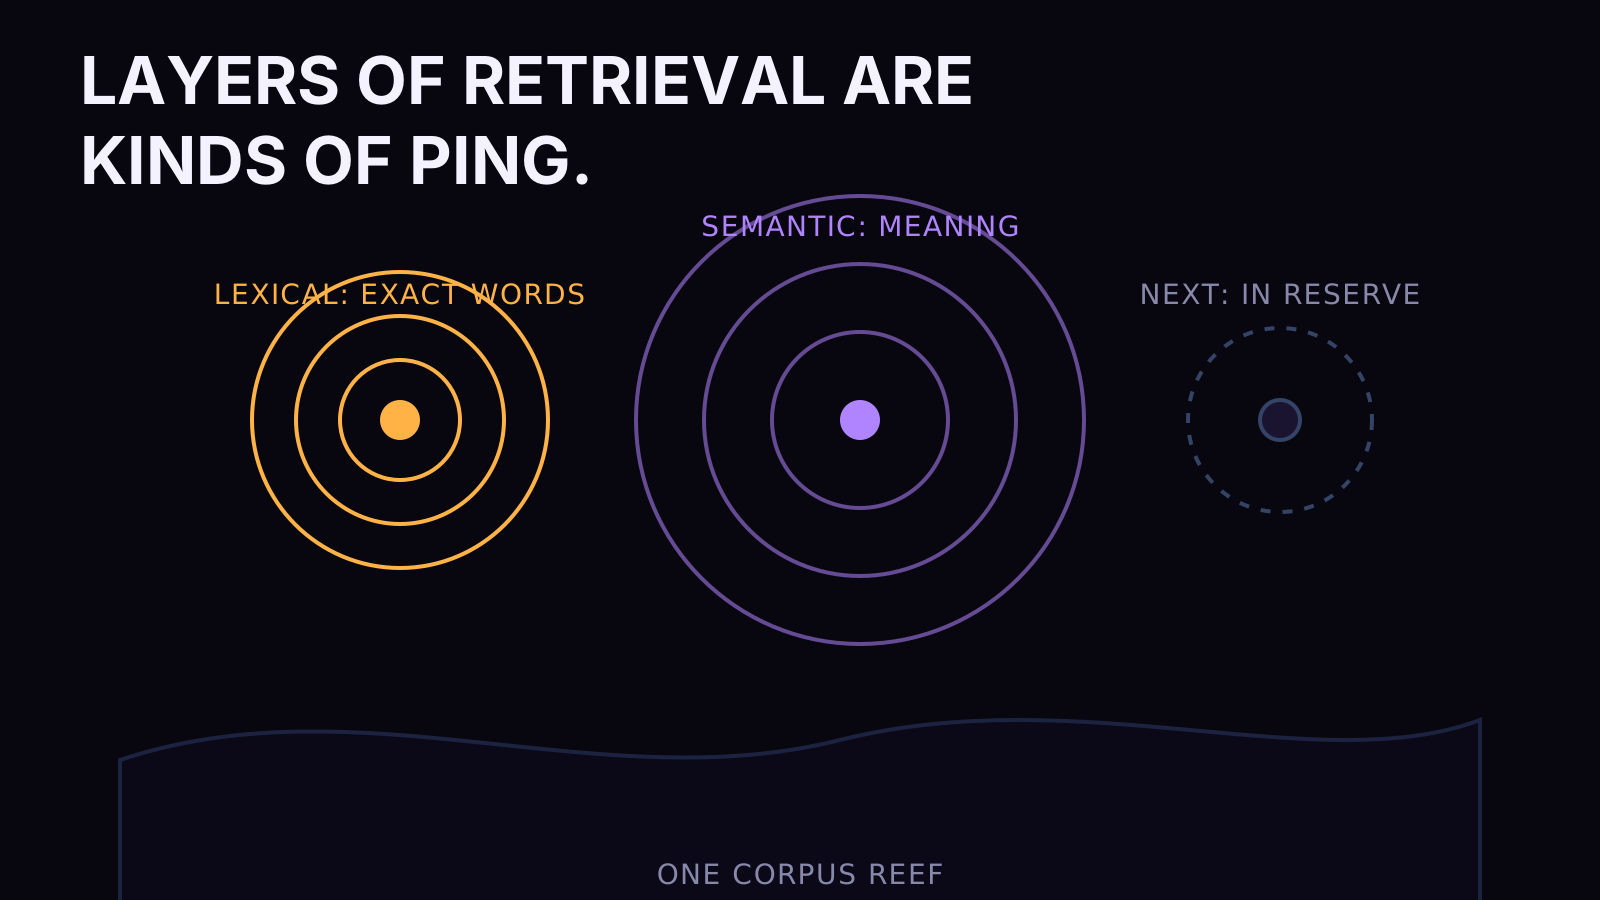
Full-text is the first layer, and the roadmap under it follows the same min-max sequencing as everything else in this note: exhaust the capability you have before buying the next one. Lexical search over a well-gated corpus answers most of what visitors ask of a site like this, so it ships first, alone, and gets measured. The next layer is semantic: embeddings as the working representation, where every chunk of writing becomes a high-dimensional vector and nearness in that space means nearness in meaning. My pipelines already think in that representation for scoring and clustering; pointing it at search is another fan-and-fold graph writing to another index, behind the same gates. Each layer is a new kind of ping over the same corpus, and the reason the sequencing works is the architecture: when adding a retrieval mode is one more subgraph and one more index declaration, layering becomes a decision about value instead of a procurement project.
The collapse this page is built for
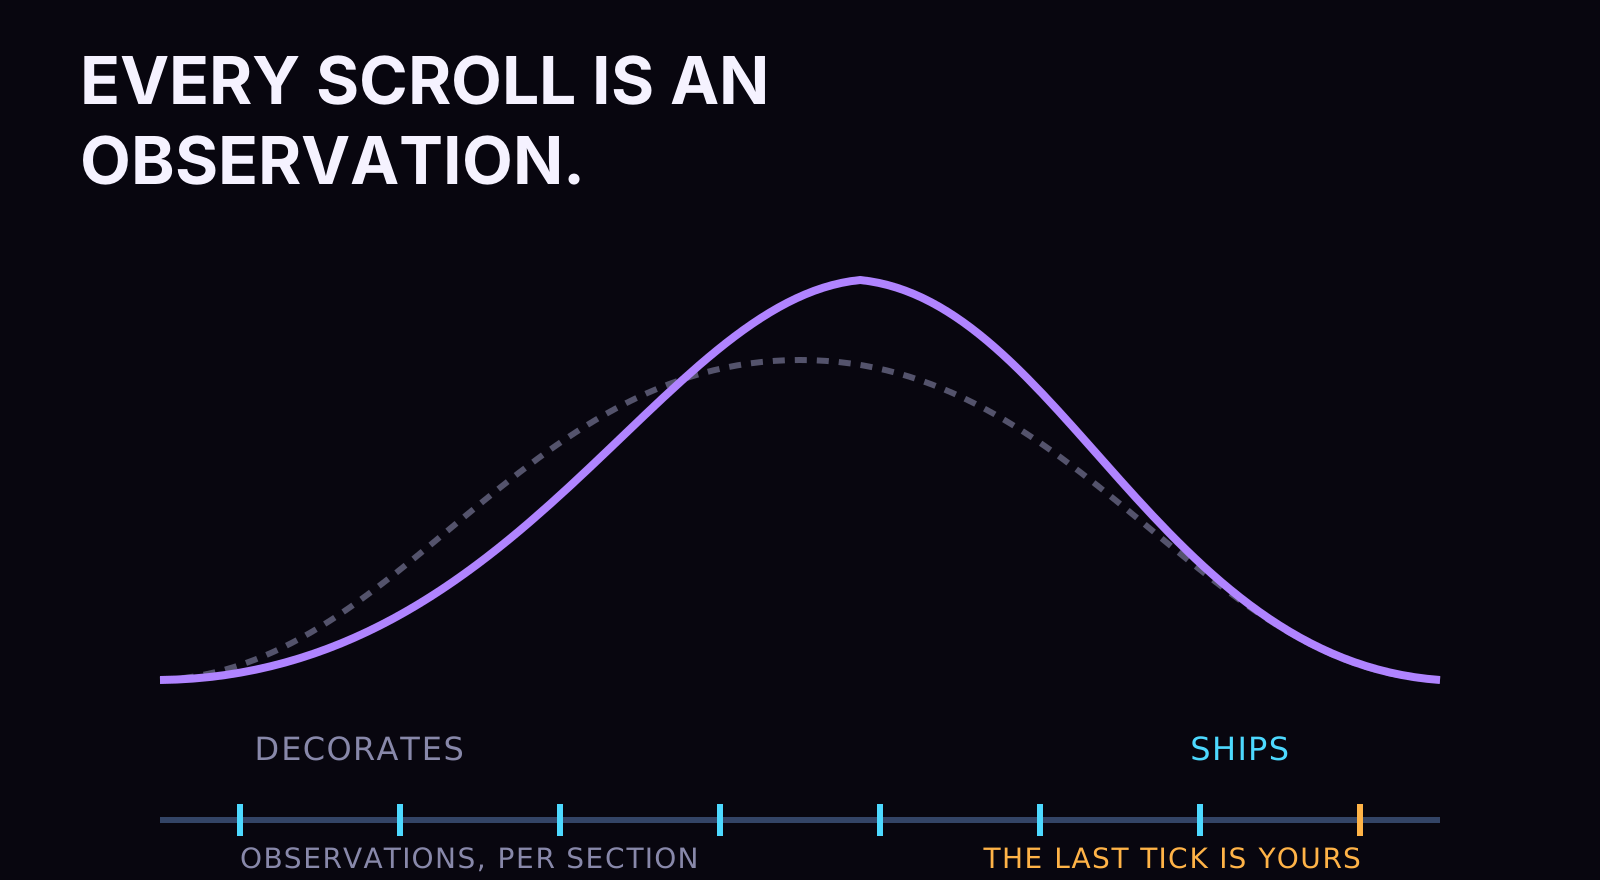
And there's a last collapse worth naming, because it's the one this site exists for. A reader like you arrives holding a superposition of judgments about me: maybe this guy ships, maybe he decorates. Every section you've scrolled has been an observation, and somewhere along the way the distribution resolves. Wave-function collapse is what a page like this is engineered to survive. I don't get to choose which way it resolves. I only get to choose what's actually running underneath when you look. That's why the stack is lean, why the gates are code, and why this note walks its receipts instead of asserting its conclusions.
The boring future, priced
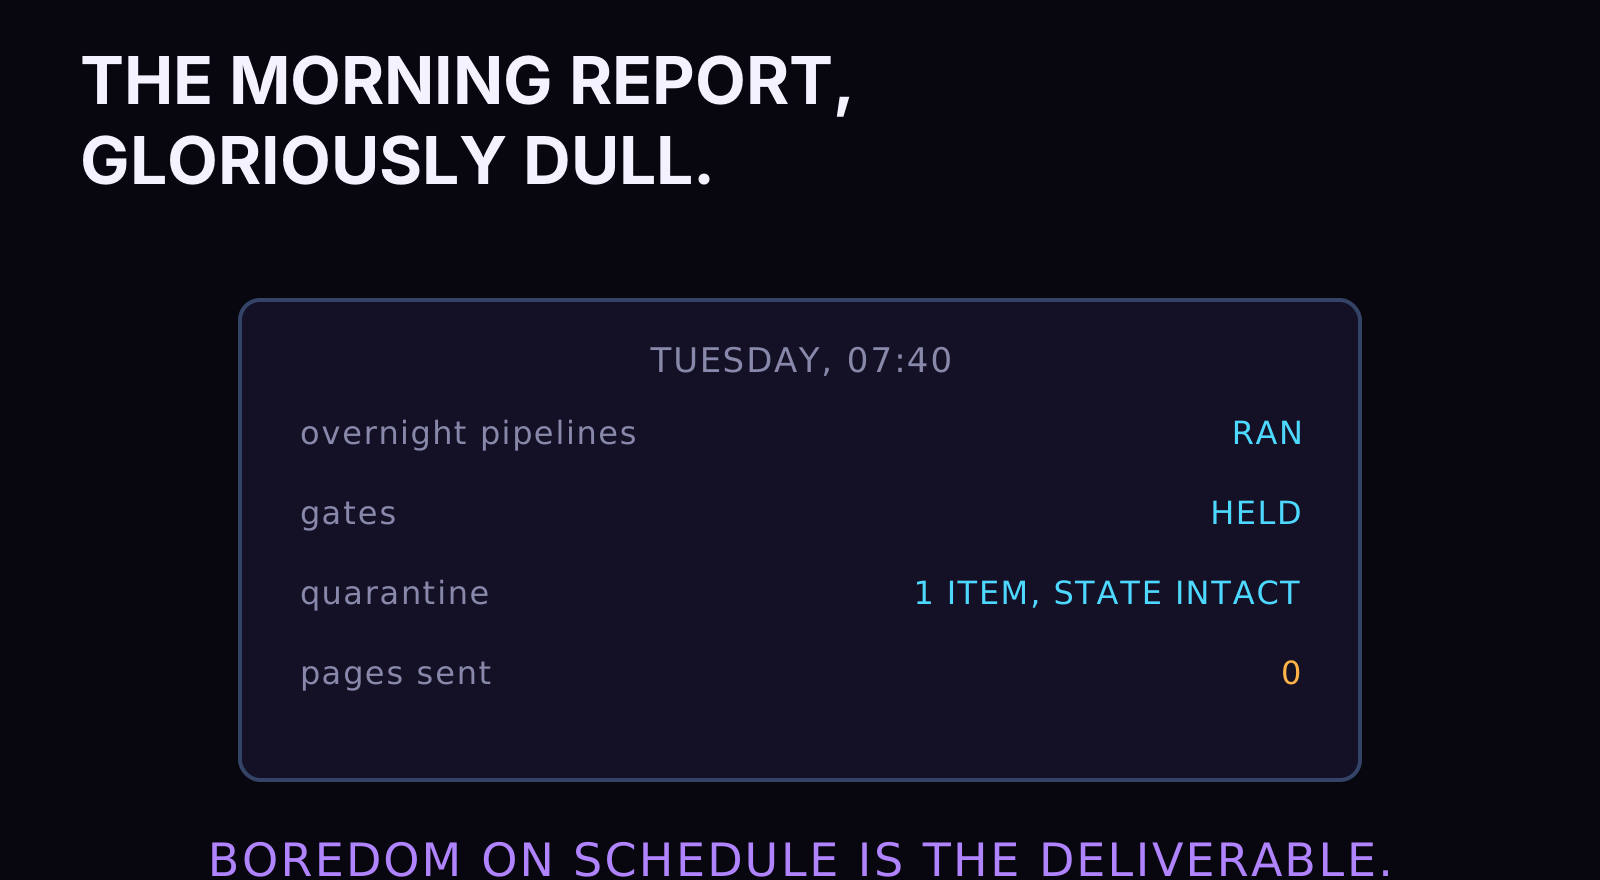
Here's the future I'm selling, in case the pitch got lost in the plumbing, and notice how boring it is. A Tuesday where the overnight pipelines ran, the gates held, the one document that failed parsing sits announced in quarantine with its state intact, and nobody got paged. Excitement in engineering means something is on fire. The whole point of typed state, programmable gates, engineered fan-out, and durable checkpoints is a system that produces boredom on schedule, and boredom on schedule is the most underpriced deliverable in this industry. That's what I build. The tools in this note are how I currently build it cheapest.
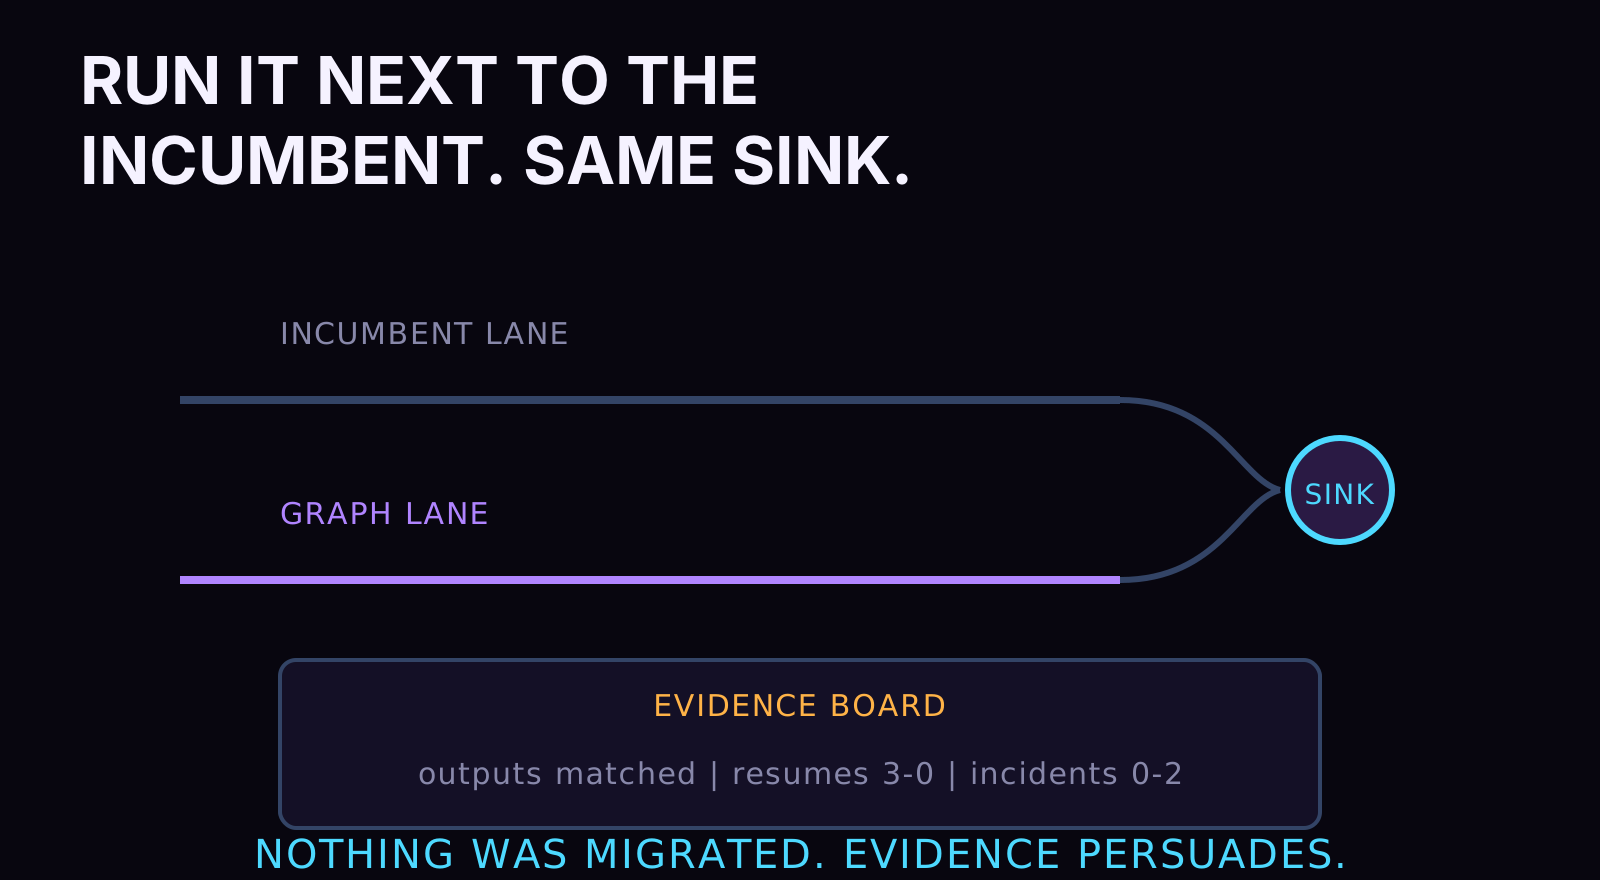
And since chapter seven promised a Monday move for your side of the table, here's what the same move looks like when I run it for someone. It starts as a diagnostic, and the diagnostic is the seven-layers drill from my sales process pointed at a stack: not "which tools do you run" but "where does the money catch fire when this breaks, and who gets yelled at." Then one pipeline, the ugliest, rewritten as a graph and run next to the incumbent, both writing to the same sink, until the evidence does the persuading. The transformation isn't a migration project; it's a demonstration that makes the migration project unnecessary, one pipeline at a time, with the platform bill shrinking as a side effect rather than a promise. That's the same sequencing this note used on you: mechanism first, receipts inline, and the conclusion left for your own audit to reach.
If you're the 90 percent, steal this
Most people who read this far are practitioners rather than prospects, and that's the audience I'd rather over-serve, so here's the liftable core with no engagement attached. The architecture in this note reduces to five decisions you can take to any codebase this month:
- Type the state and declare the merges. A shared schema with reducers replaces the mutable dict and the dedupe stage in one move.
- Route on state, loudly. One gate per pipeline where a silent fallback lives today, with quarantine as a first-class destination.
- Fan out from the data. Runtime width from a routing function; fold through the reducers you already declared.
- Compile with a checkpointer where a rerun would cost real money or real sleep, and skip it where it wouldn't. Durability is a dial.
- Let one system do five jobs before hiring a sixth. The refused-parts list is the artifact that proves the discipline.
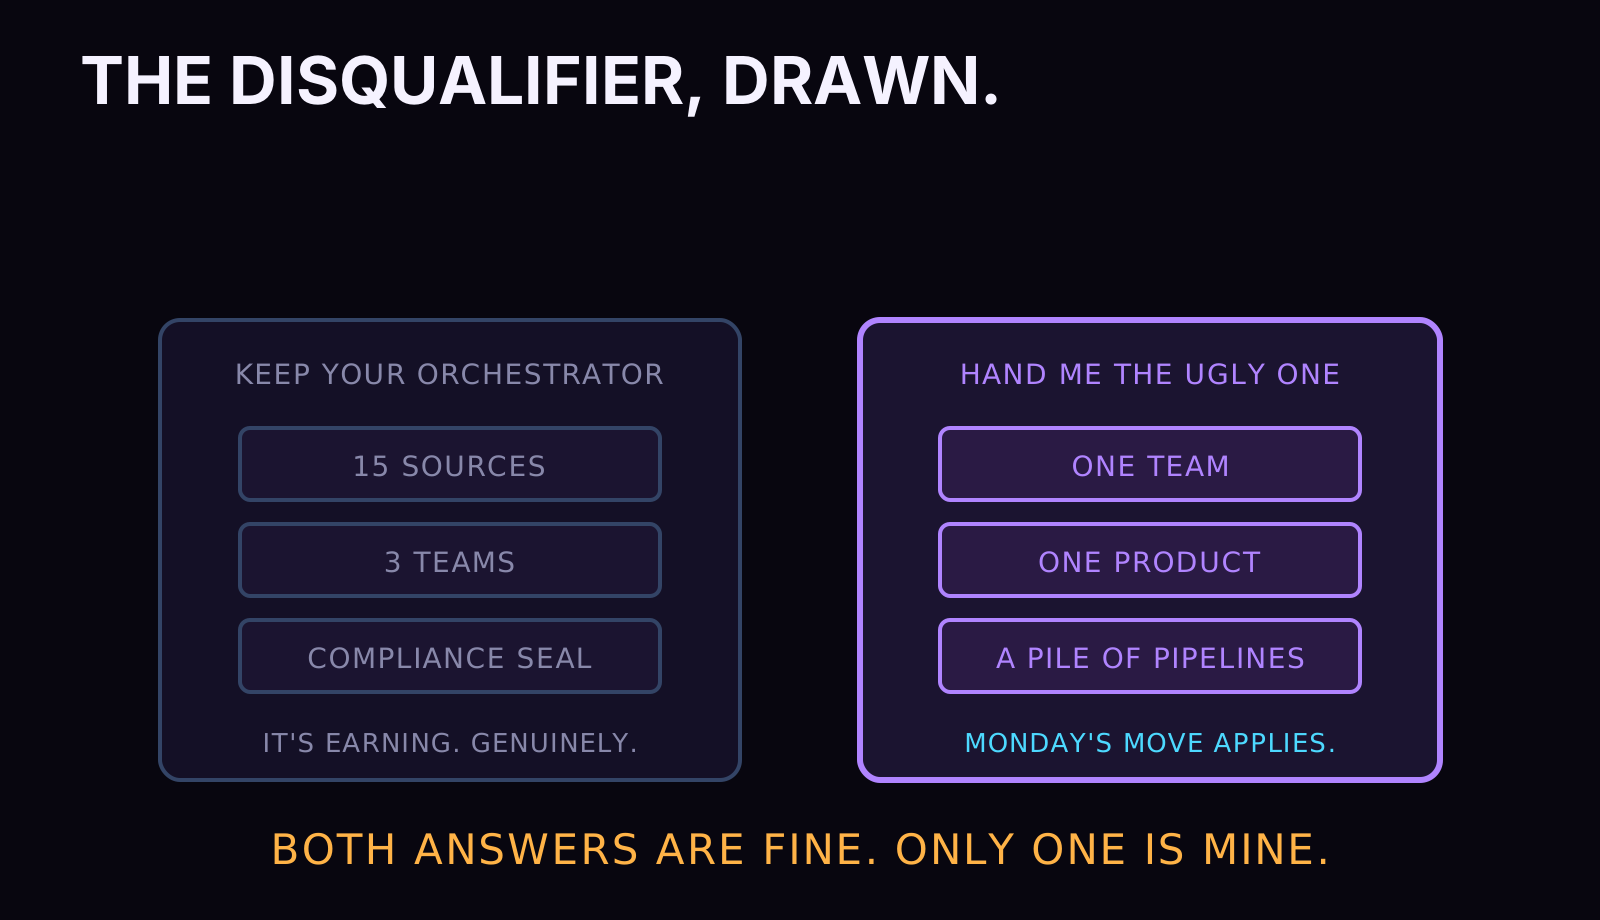
Who shouldn't call me about any of this: if your data estate spans fifteen sources across three teams, a platform group owns your scheduling substrate, and a compliance officer signs your lineage, then the border in chapter seven puts you outside my claim, and outside my services with it. Keep your orchestrator; it's earning. If you're one team with one product, a pile of pipelines feeding it, and a tooling bill that reads like a museum's insurance policy, I'm exactly your guy, and the fastest way to check is to hand me your ugliest pipeline and watch what Monday's move does to it. Either way, the search box this note came from will be sitting in the navbar, taking pings.